In this table you find the dates and contents of all classes.
Date
Time
Room
Content
Slides
Code
Data
Assignment
Oct 05, 2026
10:00-12:00
TC.5.05
Introduction
Oct 12, 2026
10:00-12:00
TC.5.05
Money · Data handling
Oct 19, 2026
10:00-12:00
TC.5.05
Monetary Regimes · Geometries
Nov 02, 2026
10:00-12:00
TC.5.05
Quantitative Easing · Scales
Nov 09, 2026
10:00-12:00
TC.5.05
Effects of Monetary Policy · Colors
Nov 16, 2026
10:00-12:00
TC.5.05
Financialization and Debt · Labels
Nov 23, 2026
10:00-12:00
TC.5.05
Introduction into data by OeNB
Nov 30, 2026
10:00-12:00
TC.5.05
Introduction into data by OeNB
Dec 14, 2026
10:00-12:00
TC.5.03
Monetary inequalities · Maps
Jan 11, 2027
10:00-12:00
TC.5.05
Student presentations
Jan 18, 2027
10:00-12:00
TC.5.05
Student presentations
Jan 25, 2027
10:00-12:00
TC.5.05
Award ceremony at OeNB
Assignments
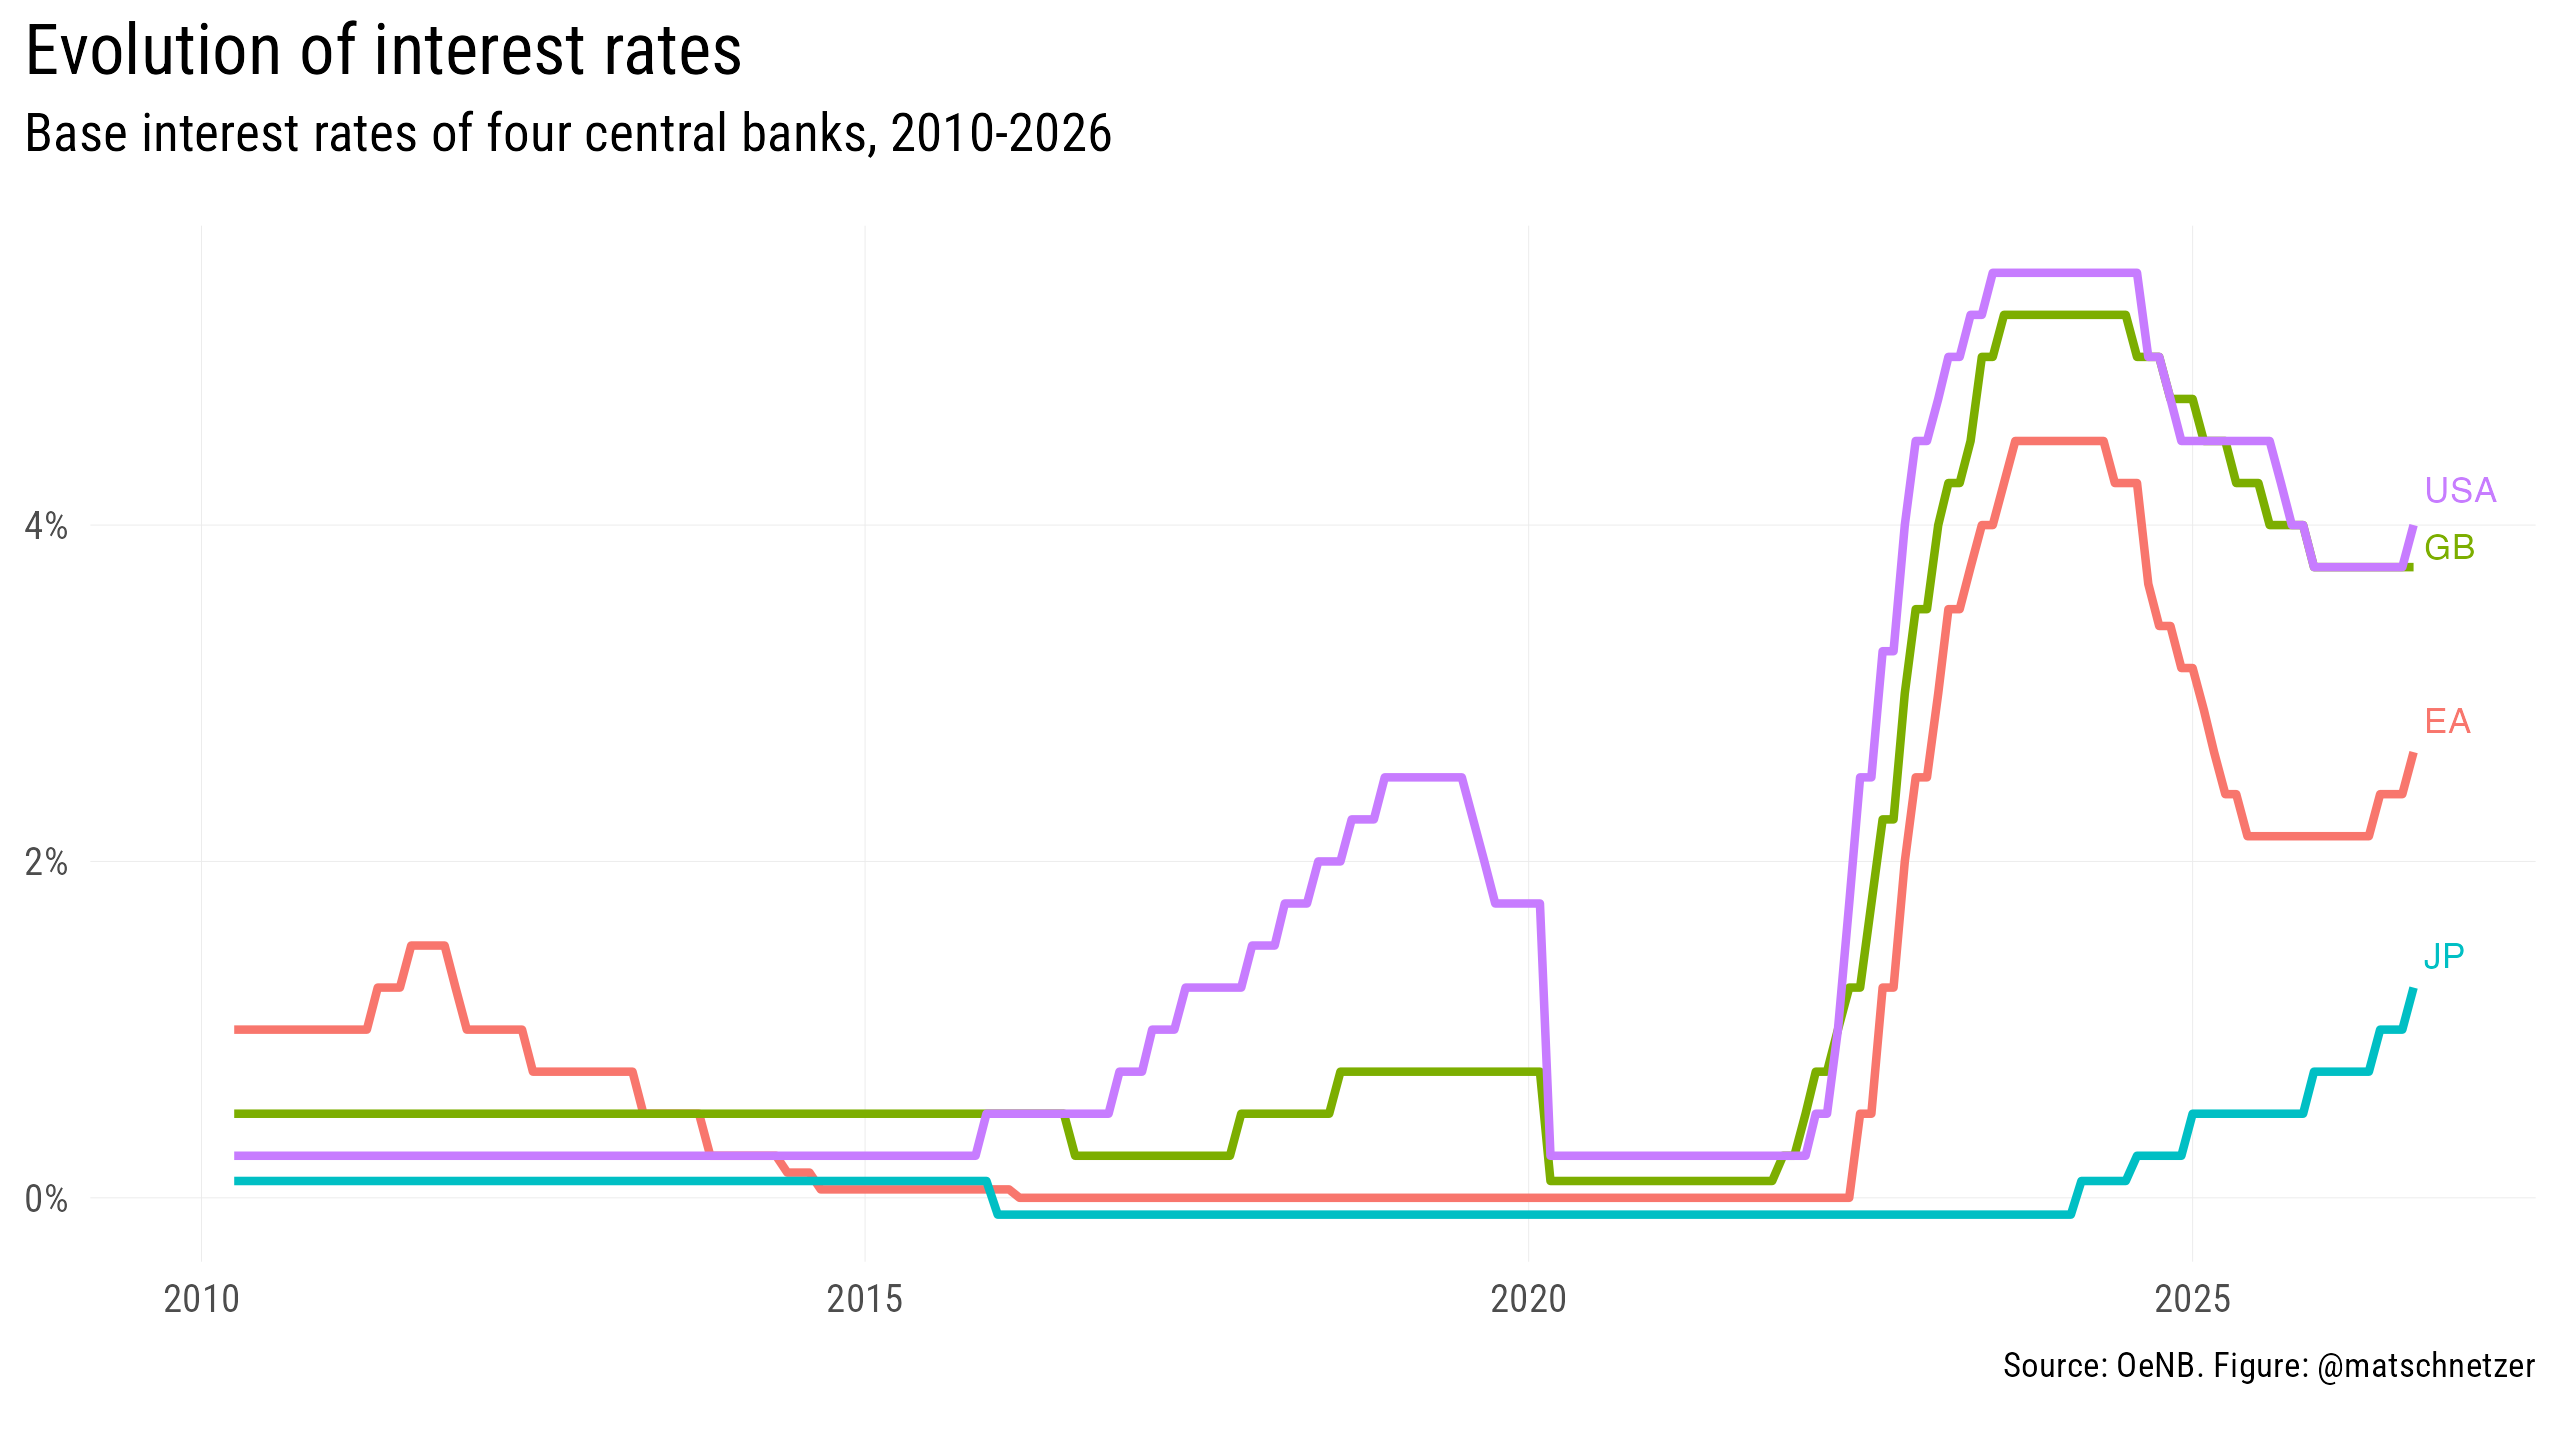
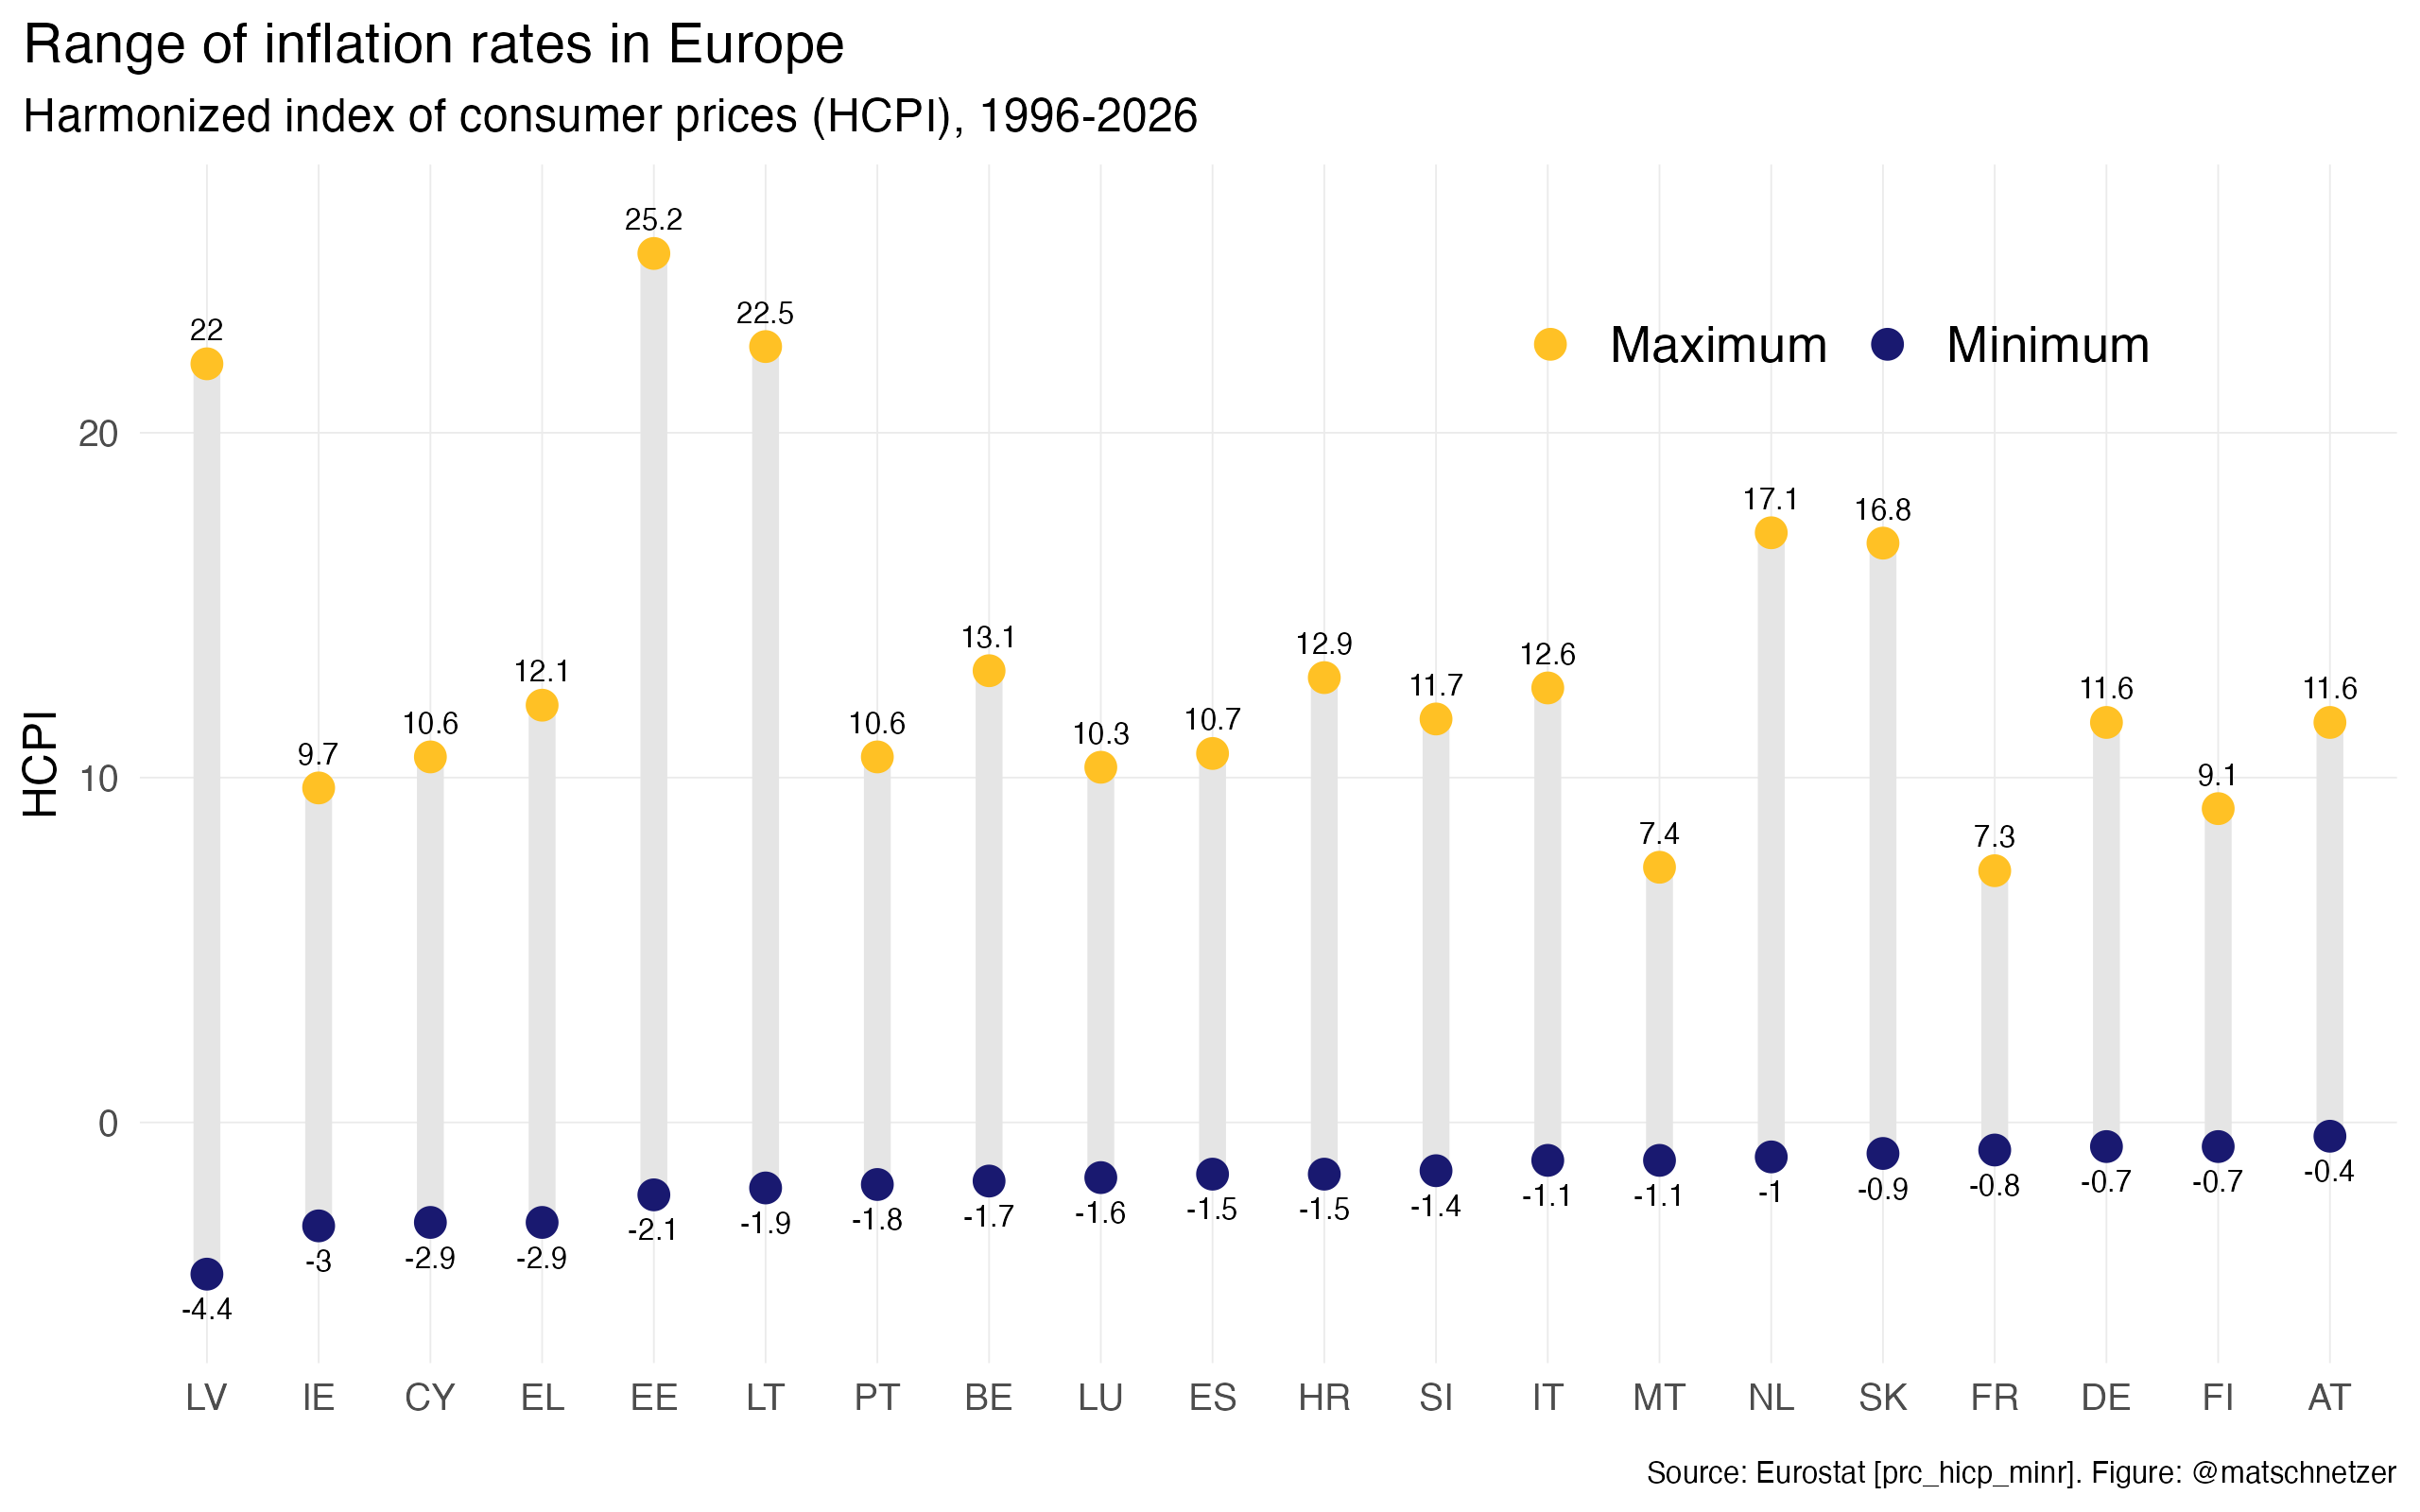
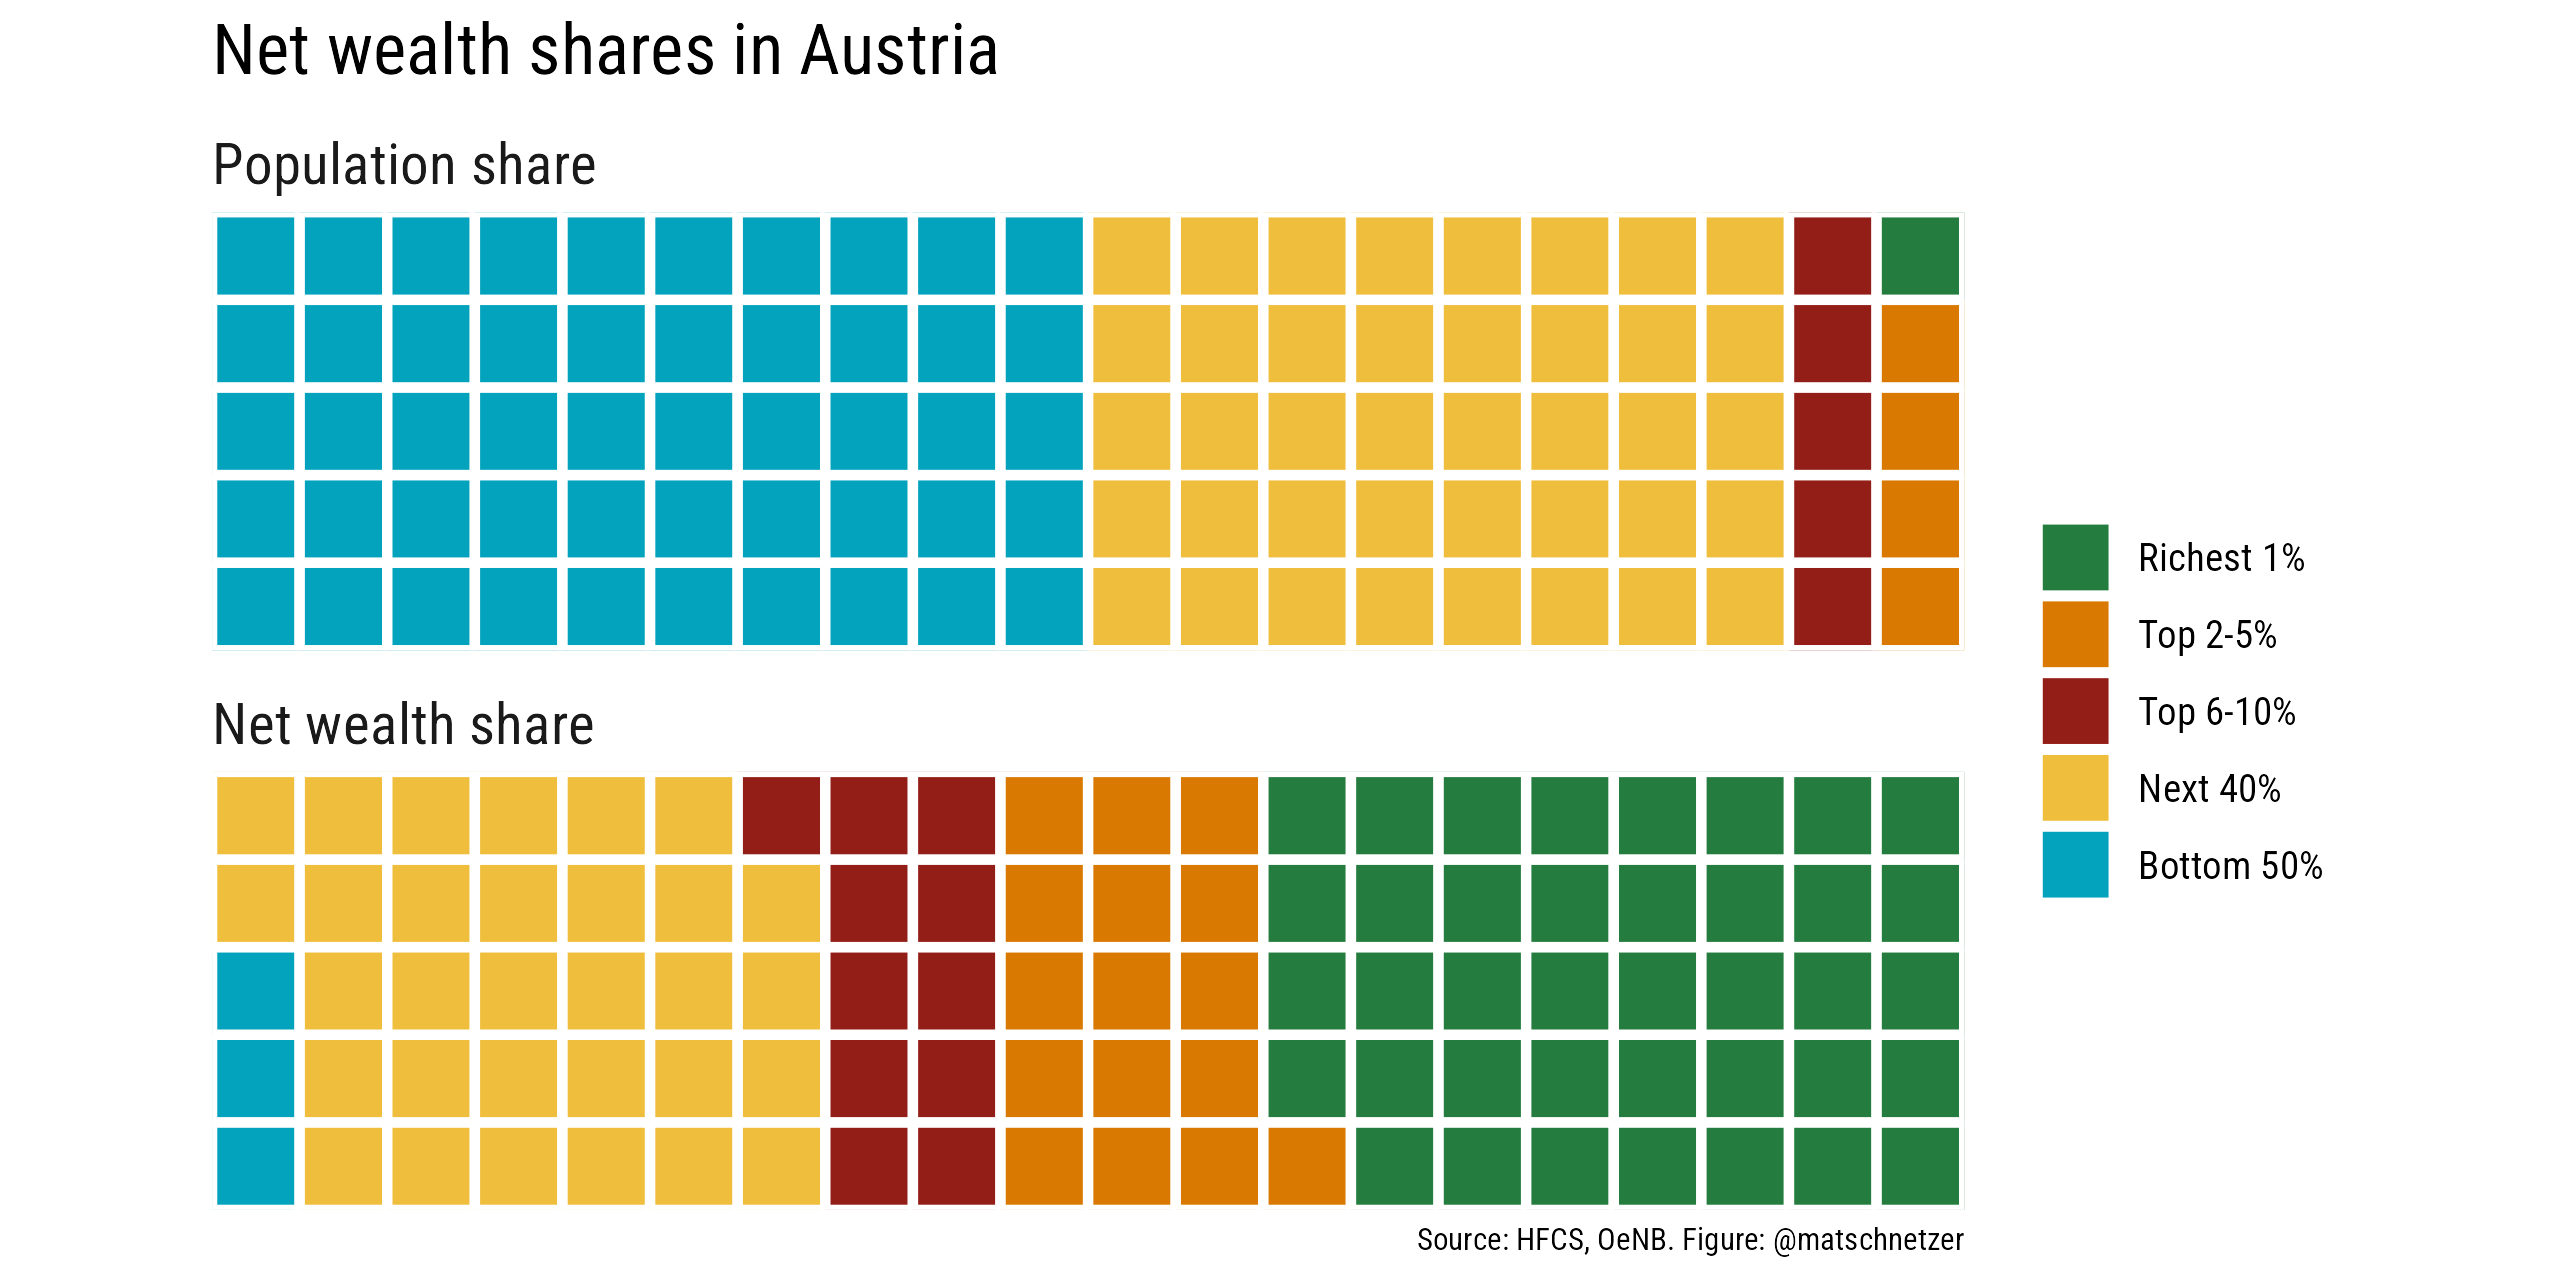
Assignment [1] provides the setup of the R infrastructure that is required in this course. There are no points for this assignment. Assignments [2] to [4] are recreations of examplary figures provided below. These examples are related to figures that are discussed in class. Students should then try to reproduce the plots at home and improve their individual coding skills. The raw data for the figures are available as *.csv files below.
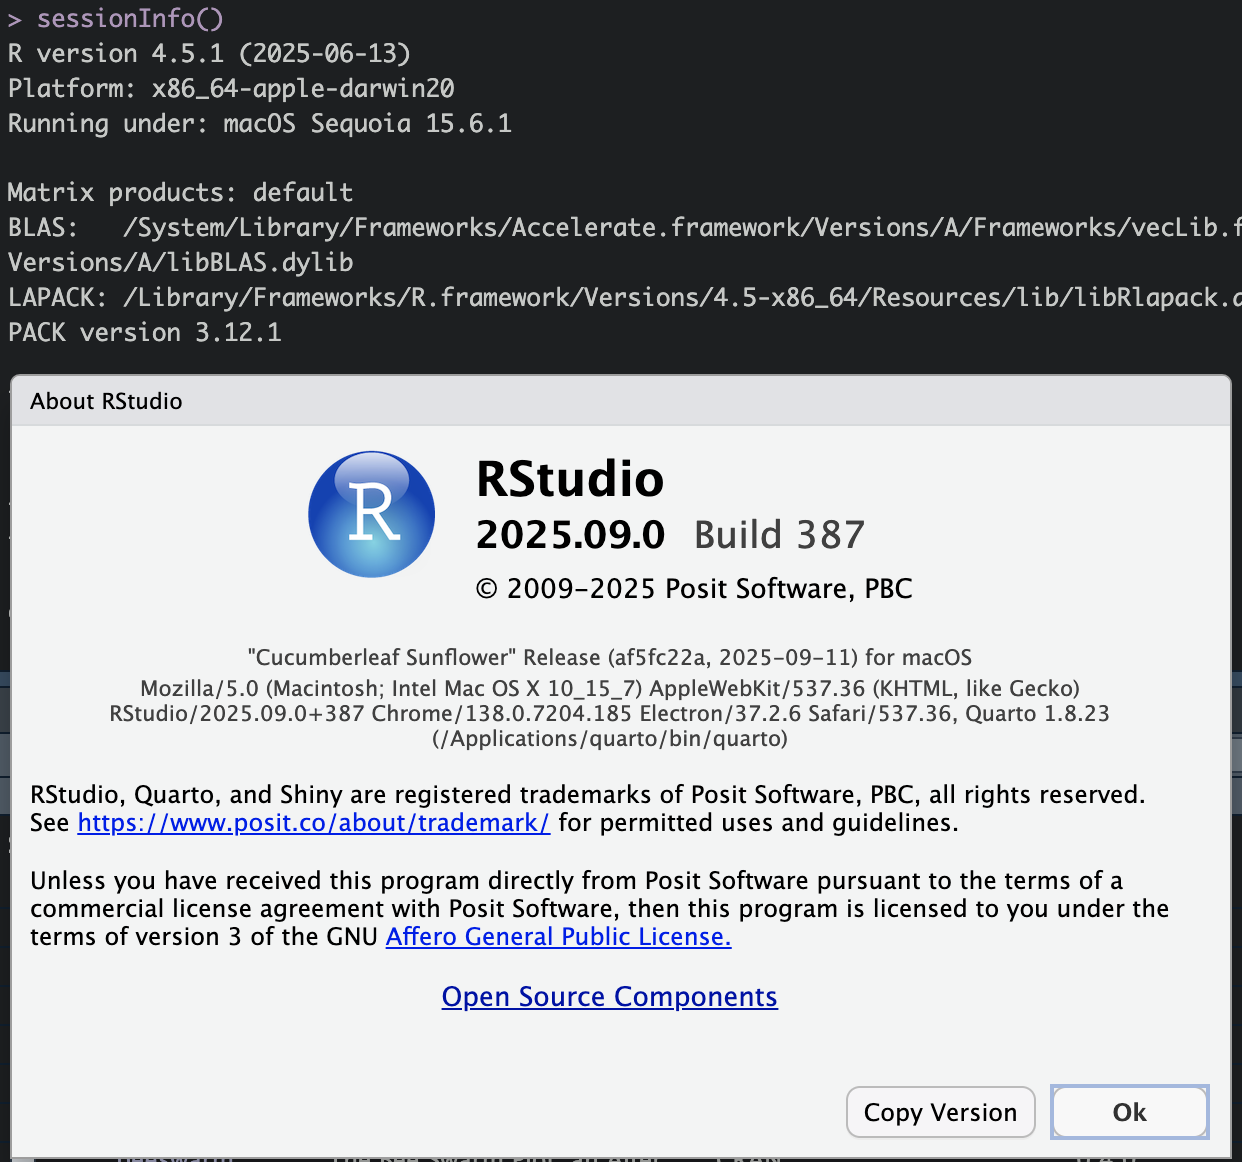
Open RStudio, copy the following code into the console and execute: install.packages(c("tidyverse", "rmarkdown", "scales", "lubridate", "colorspace", "devtools")); sessionInfo()
Click on Help > About RStudio
Make sure that both the R version (Console) and the RStudio version are visible, take a screenshot and upload it to Canvas before October 12, 2026 at 9 a.m.
Homework 2
Please submit your chart before November 09, 2026 at 9 a.m. The data for this assignment is available here:
Homework 3
Please submit your chart before November 23, 2026 at 9 a.m. The data for this assignment is available here:
Homework 4
Please submit your chart before December 14, 2026 at 9 a.m. The data for this assignment is available here: