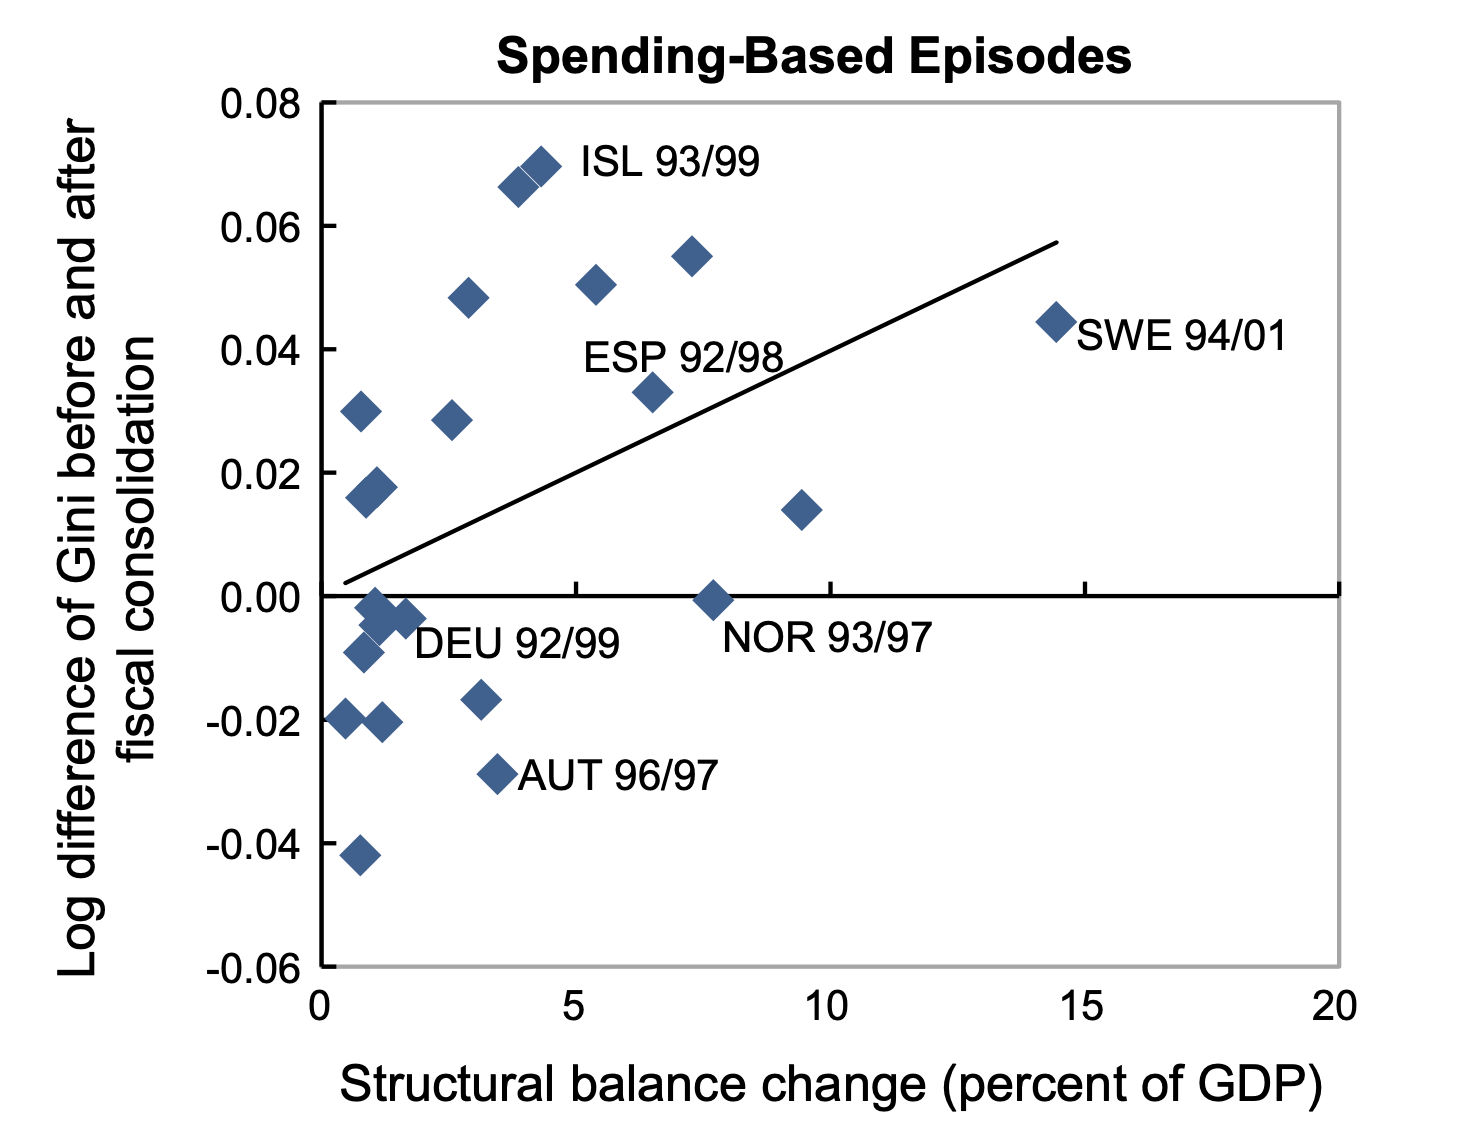
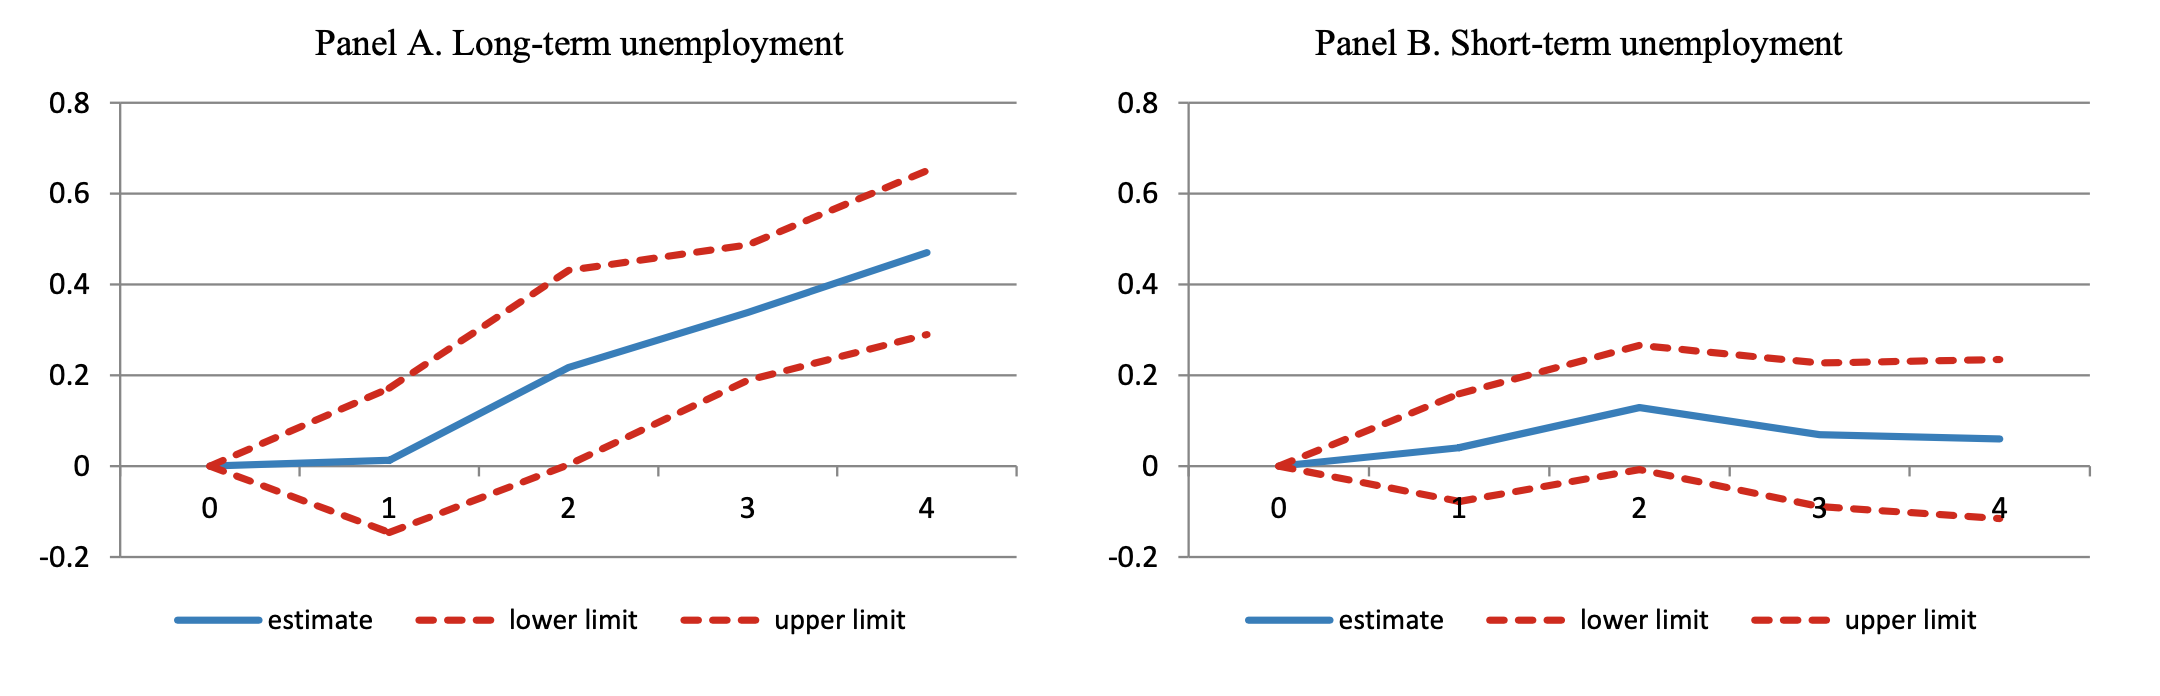
Agnello, Luca/Sousa, Ricardo M. (2014). How Does Fiscal Consolidation Impact on Income Inequality?
Review of Income and Wealth,
60(4), 702–726. DOI:
10.1111/roiw.12004
Anderesen, Asger Lau/Johannesen, Niels/Jørgensen, Mia/Peydró, José-Luis (2023). Monetary Policy and Inequality.
The Journal of Finance,
78(5), 2945–2989. DOI:
10.1111/jofi.13262
Ball, Laurence/Furceri, Davide/Leigh, Daniel/Loungani, Prakash (2013). The distributional effects of fiscal consolidation (Working Paper No. WP/13/151). IMF.
Çerçil, İrfan/Aksaray, Gorkem (2025). Monetary Policy and Inequality: Distributional Effects of Asset Purchase Programs.
Journal of International Money and Finance,
157, 103384. DOI:
10.1016/j.jimonfin.2025.103384
Coibion, Olivier/Gorodnichenko, Yuriy/Kueng, Lorenz/Silvia, John (2017). Innocent Bystanders? Monetary Policy and Inequality.
Journal of Monetary Economics,
88, 70–89. DOI:
10.1016/j.jmoneco.2017.05.005
Doko Tchatoka, Firmin/Haque, Qazi (2024). Revisiting the Macroeconomic Effects of Monetary Policy Shocks.
Economic Record,
100(329), 234–259. DOI:
10.1111/1475-4932.12801
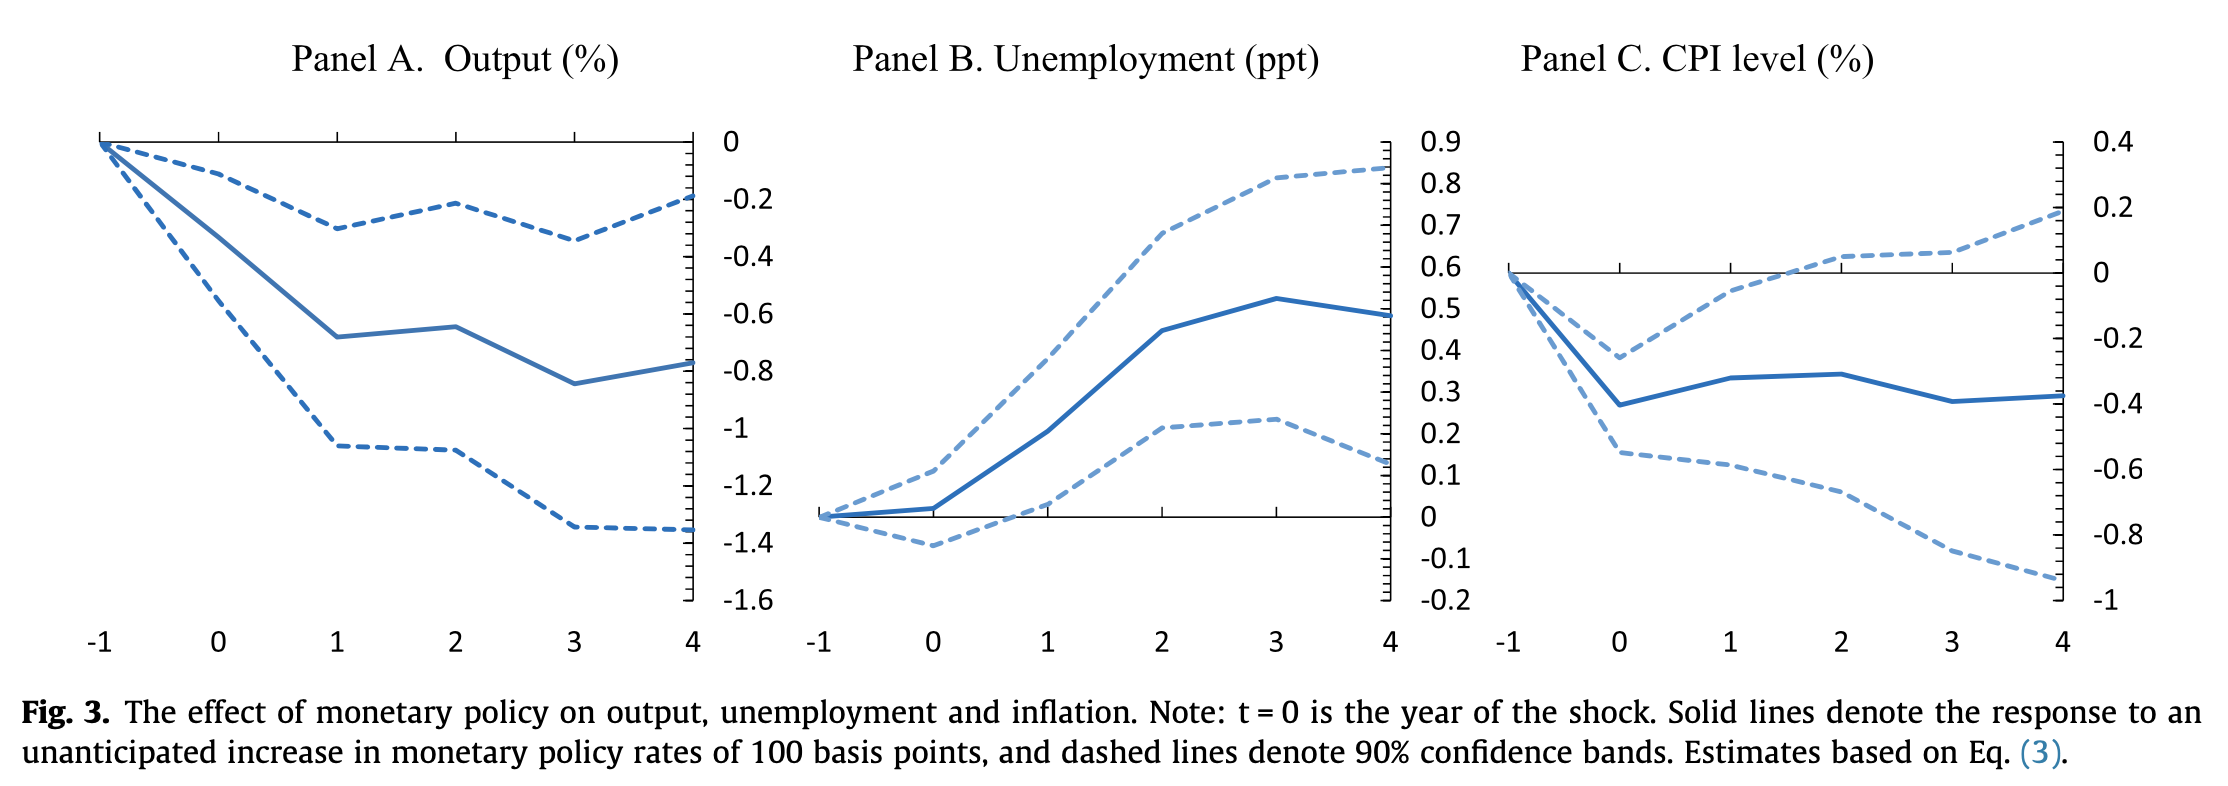
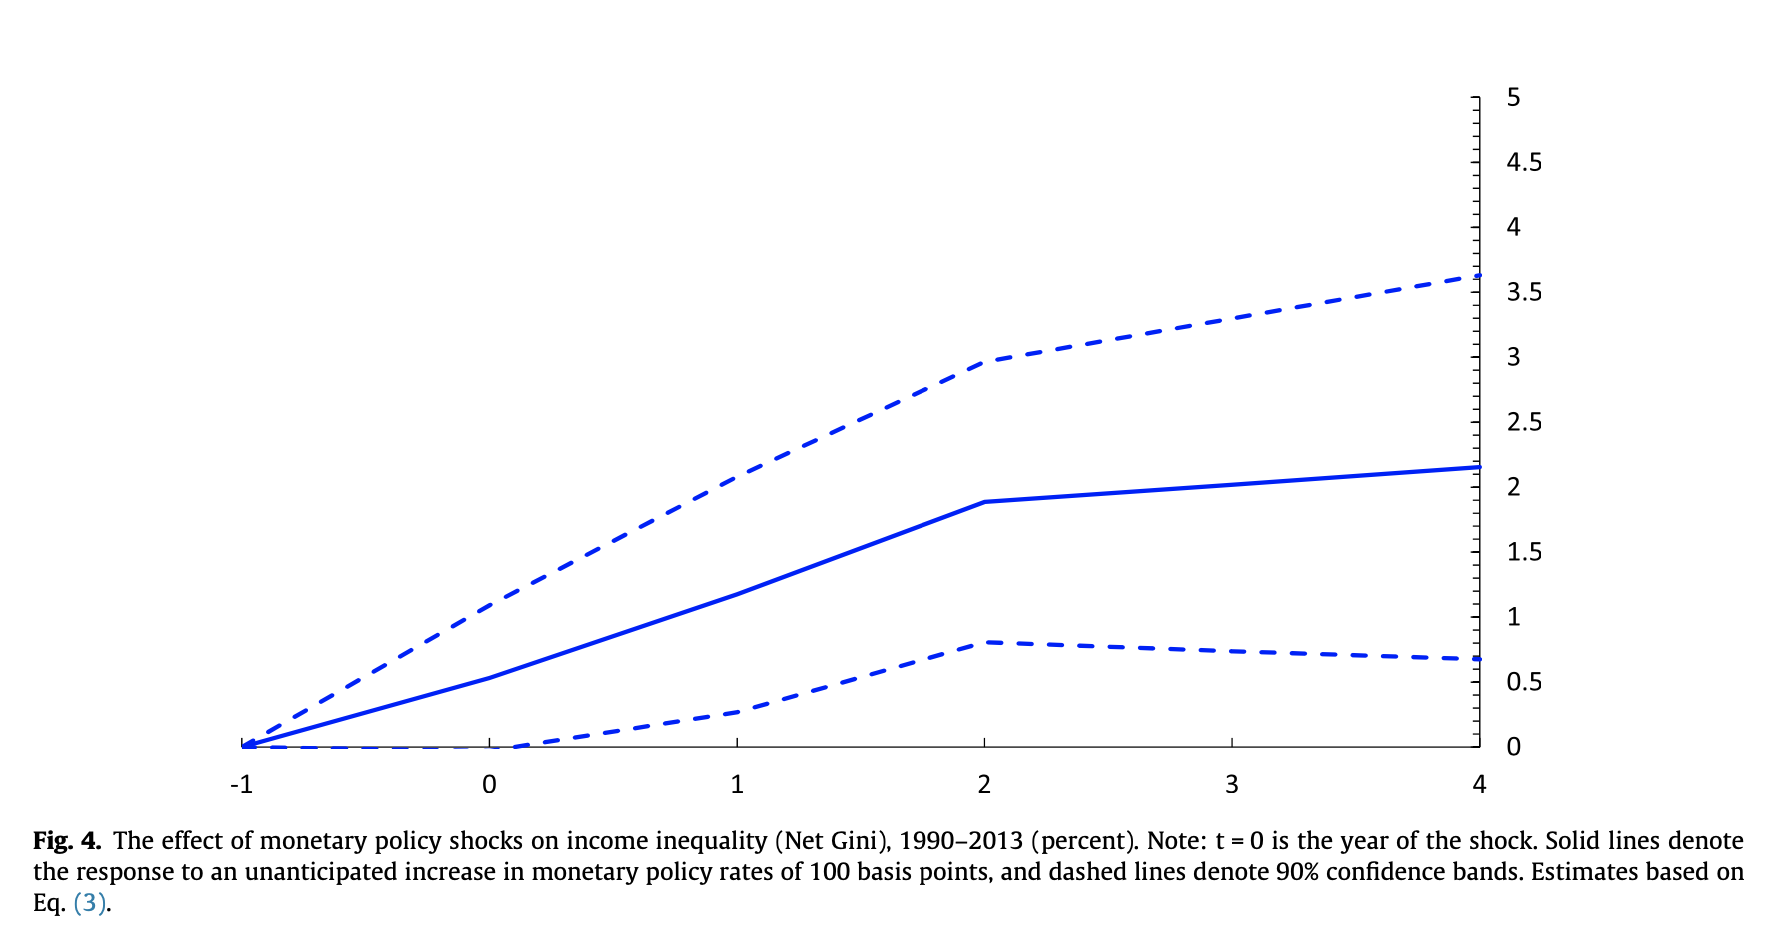
Furceri, Davide/Loungani, Prakash/Zdzienicka, Aleksandra (2018). The Effects of Monetary Policy Shocks on Inequality.
Journal of International Money and Finance,
85, 168–186. DOI:
10.1016/j.jimonfin.2017.11.004
Heimberger, Philipp (2020). The Dynamic Effects of Fiscal Consolidation Episodes on Income Inequality: Evidence for 17
OECD Countries over 1978
2013.
Empirica,
47(1), 53–81. DOI:
10.1007/s10663-018-9404-z
Jordà, Òscar (2005). Estimation and Inference of Impulse Responses by Local Projections.
American Economic Review,
95(1), 161–182. DOI:
10.1257/0002828053828518
Koukouridis, Athanasios (2025). Bank Profitability in Times of Quantitative Easing: The Role of Central Bank Transparency.
Economies,
13(6), 161. DOI:
10.3390/economies13060161
McKay, Alisdair/Wolf, Christian K. (2023). Monetary Policy and Inequality.
Journal of Economic Perspectives,
37(1), 121–144. DOI:
10.1257/jep.37.1.121
Miranda-Agrippino, Silvia/Ricco, Giovanni (2021). The Transmission of Monetary Policy Shocks.
American Economic Journal: Macroeconomics,
13(3), 74–107. DOI:
10.1257/mac.20180124
Mumtaz, Haroon/Theophilopoulou, Angeliki (2017). The Impact of Monetary Policy on Inequality in the UK. An Empirical Analysis.
European Economic Review,
98, 410–423. DOI:
10.1016/j.euroecorev.2017.07.008
Woo, Jaejoon/Bova, Elva/Kinda, Tidiane/Zhang, Y. Sophia (2016). Distributional Consequences of Fiscal Adjustments: What Do the Data Say?
IMF Economic Review,
65(2), 273–307. DOI:
10.1057/s41308-016-0021-1