| Obs. | X | Y | X | Y | X | Y | X | Y |
|---|---|---|---|---|---|---|---|---|
| 1 | 10.00 | 8.04 | 10.00 | 9.14 | 10.00 | 7.46 | 8.00 | 6.58 |
| 2 | 8.00 | 6.95 | 8.00 | 8.14 | 8.00 | 6.77 | 8.00 | 5.76 |
| 3 | 13.00 | 7.58 | 13.00 | 8.74 | 13.00 | 12.74 | 8.00 | 7.71 |
| 4 | 9.00 | 8.81 | 9.00 | 8.77 | 9.00 | 7.11 | 8.00 | 8.84 |
| 5 | 11.00 | 8.33 | 11.00 | 9.26 | 11.00 | 7.81 | 8.00 | 8.47 |
| 6 | 14.00 | 9.96 | 14.00 | 8.10 | 14.00 | 8.84 | 8.00 | 7.04 |
| 7 | 6.00 | 7.24 | 6.00 | 6.13 | 6.00 | 6.08 | 8.00 | 5.25 |
| 8 | 4.00 | 4.26 | 4.00 | 3.10 | 4.00 | 5.39 | 19.00 | 12.50 |
| 9 | 12.00 | 10.84 | 12.00 | 9.13 | 12.00 | 8.15 | 8.00 | 5.56 |
| 10 | 7.00 | 4.82 | 7.00 | 7.26 | 7.00 | 6.42 | 8.00 | 7.91 |
| 11 | 5.00 | 5.68 | 5.00 | 4.74 | 5.00 | 5.73 | 8.00 | 6.89 |
| Mean | 9.00 | 7.50 | 9.00 | 7.50 | 9.00 | 7.50 | 9.00 | 7.50 |
| SD | 3.32 | 2.03 | 3.32 | 2.03 | 3.32 | 2.03 | 3.32 | 2.03 |
| Corr | 0.82 | NA | 0.82 | NA | 0.82 | NA | 0.82 | NA |
Monetary Policy Visualization
Introduction
October 5, 2026
Lecturers


- Dr. Matthias Schnetzer
- https://mschnetzer.github.io
- mschnetz@wu.ac.at
- mschnetzer
- Patrick Mokre, PhD
- https://www.patrickmokre.com
- patrick.mokre@akwien.at
- patrickmokre
Collaboration with OeNB
This course is a collaboration with the Austrian National Bank (OeNB). The bank will exclusively provide datasets for this class to create data visualizations.

There will be an award ceremony at the end of the course where the best visualizations will be presented at the OeNB.
Who are you?




What do you expect of this course? Do you already have some coding experience in R?
Assignments
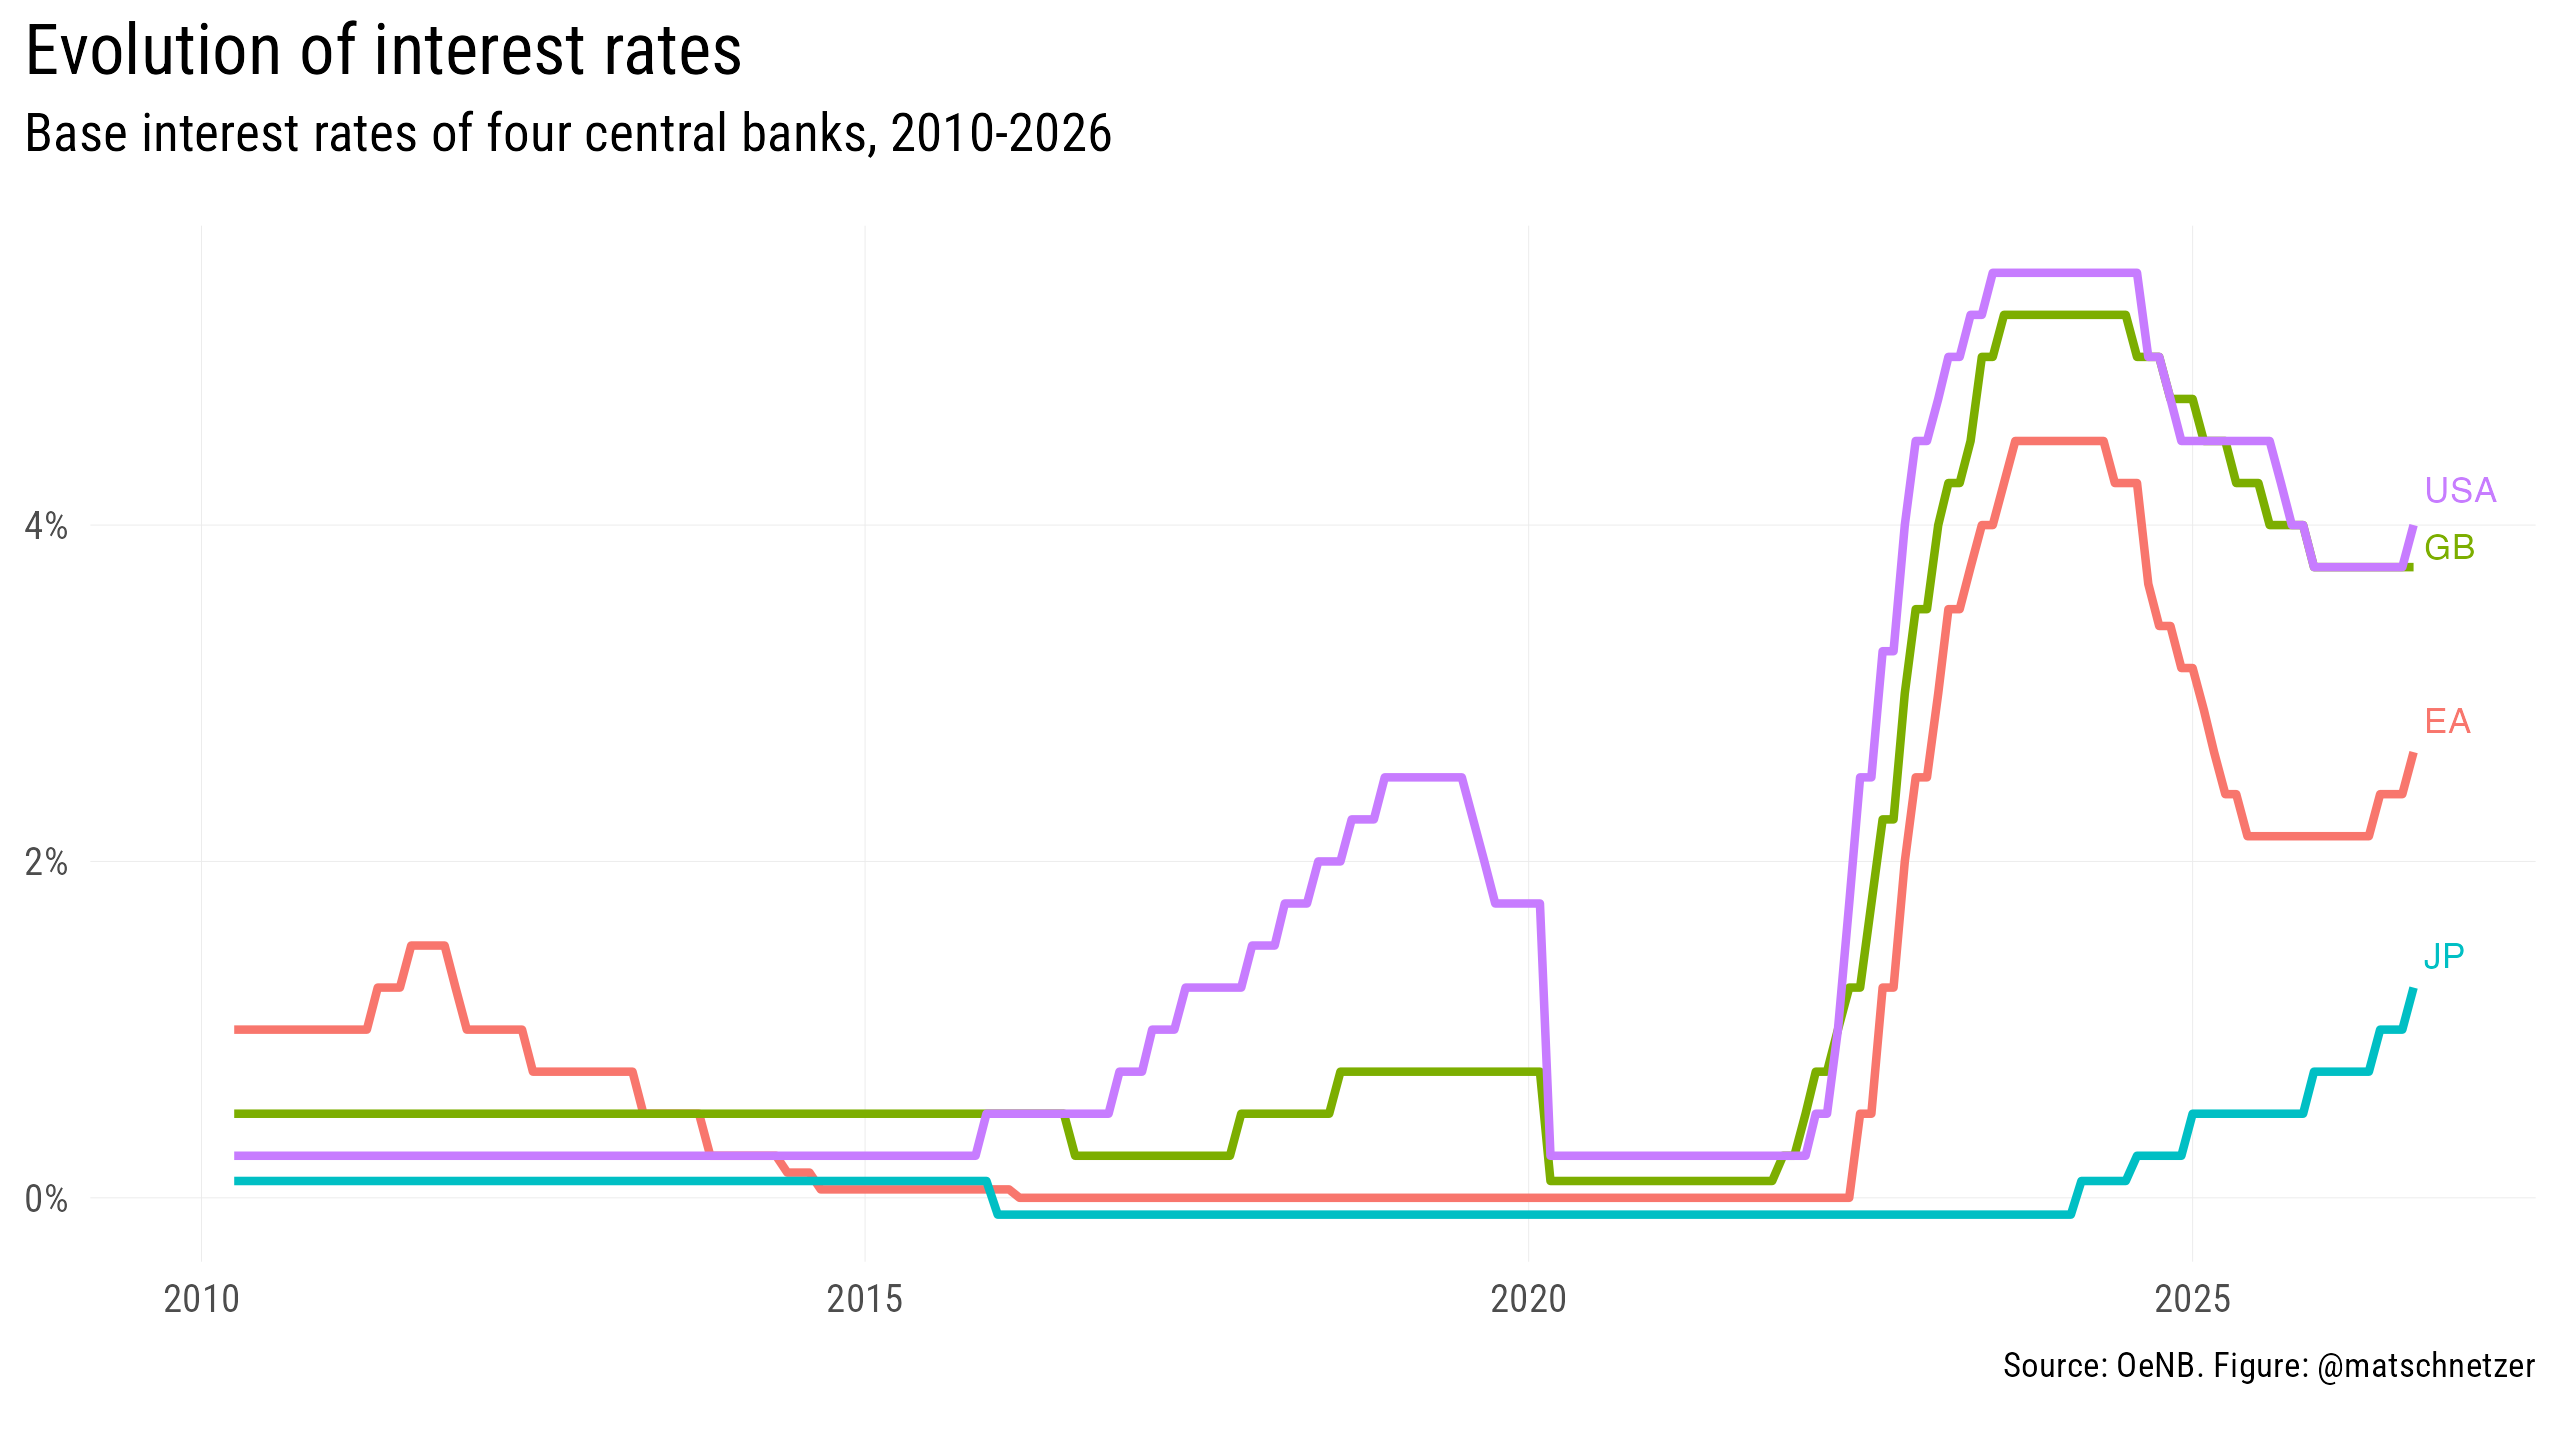
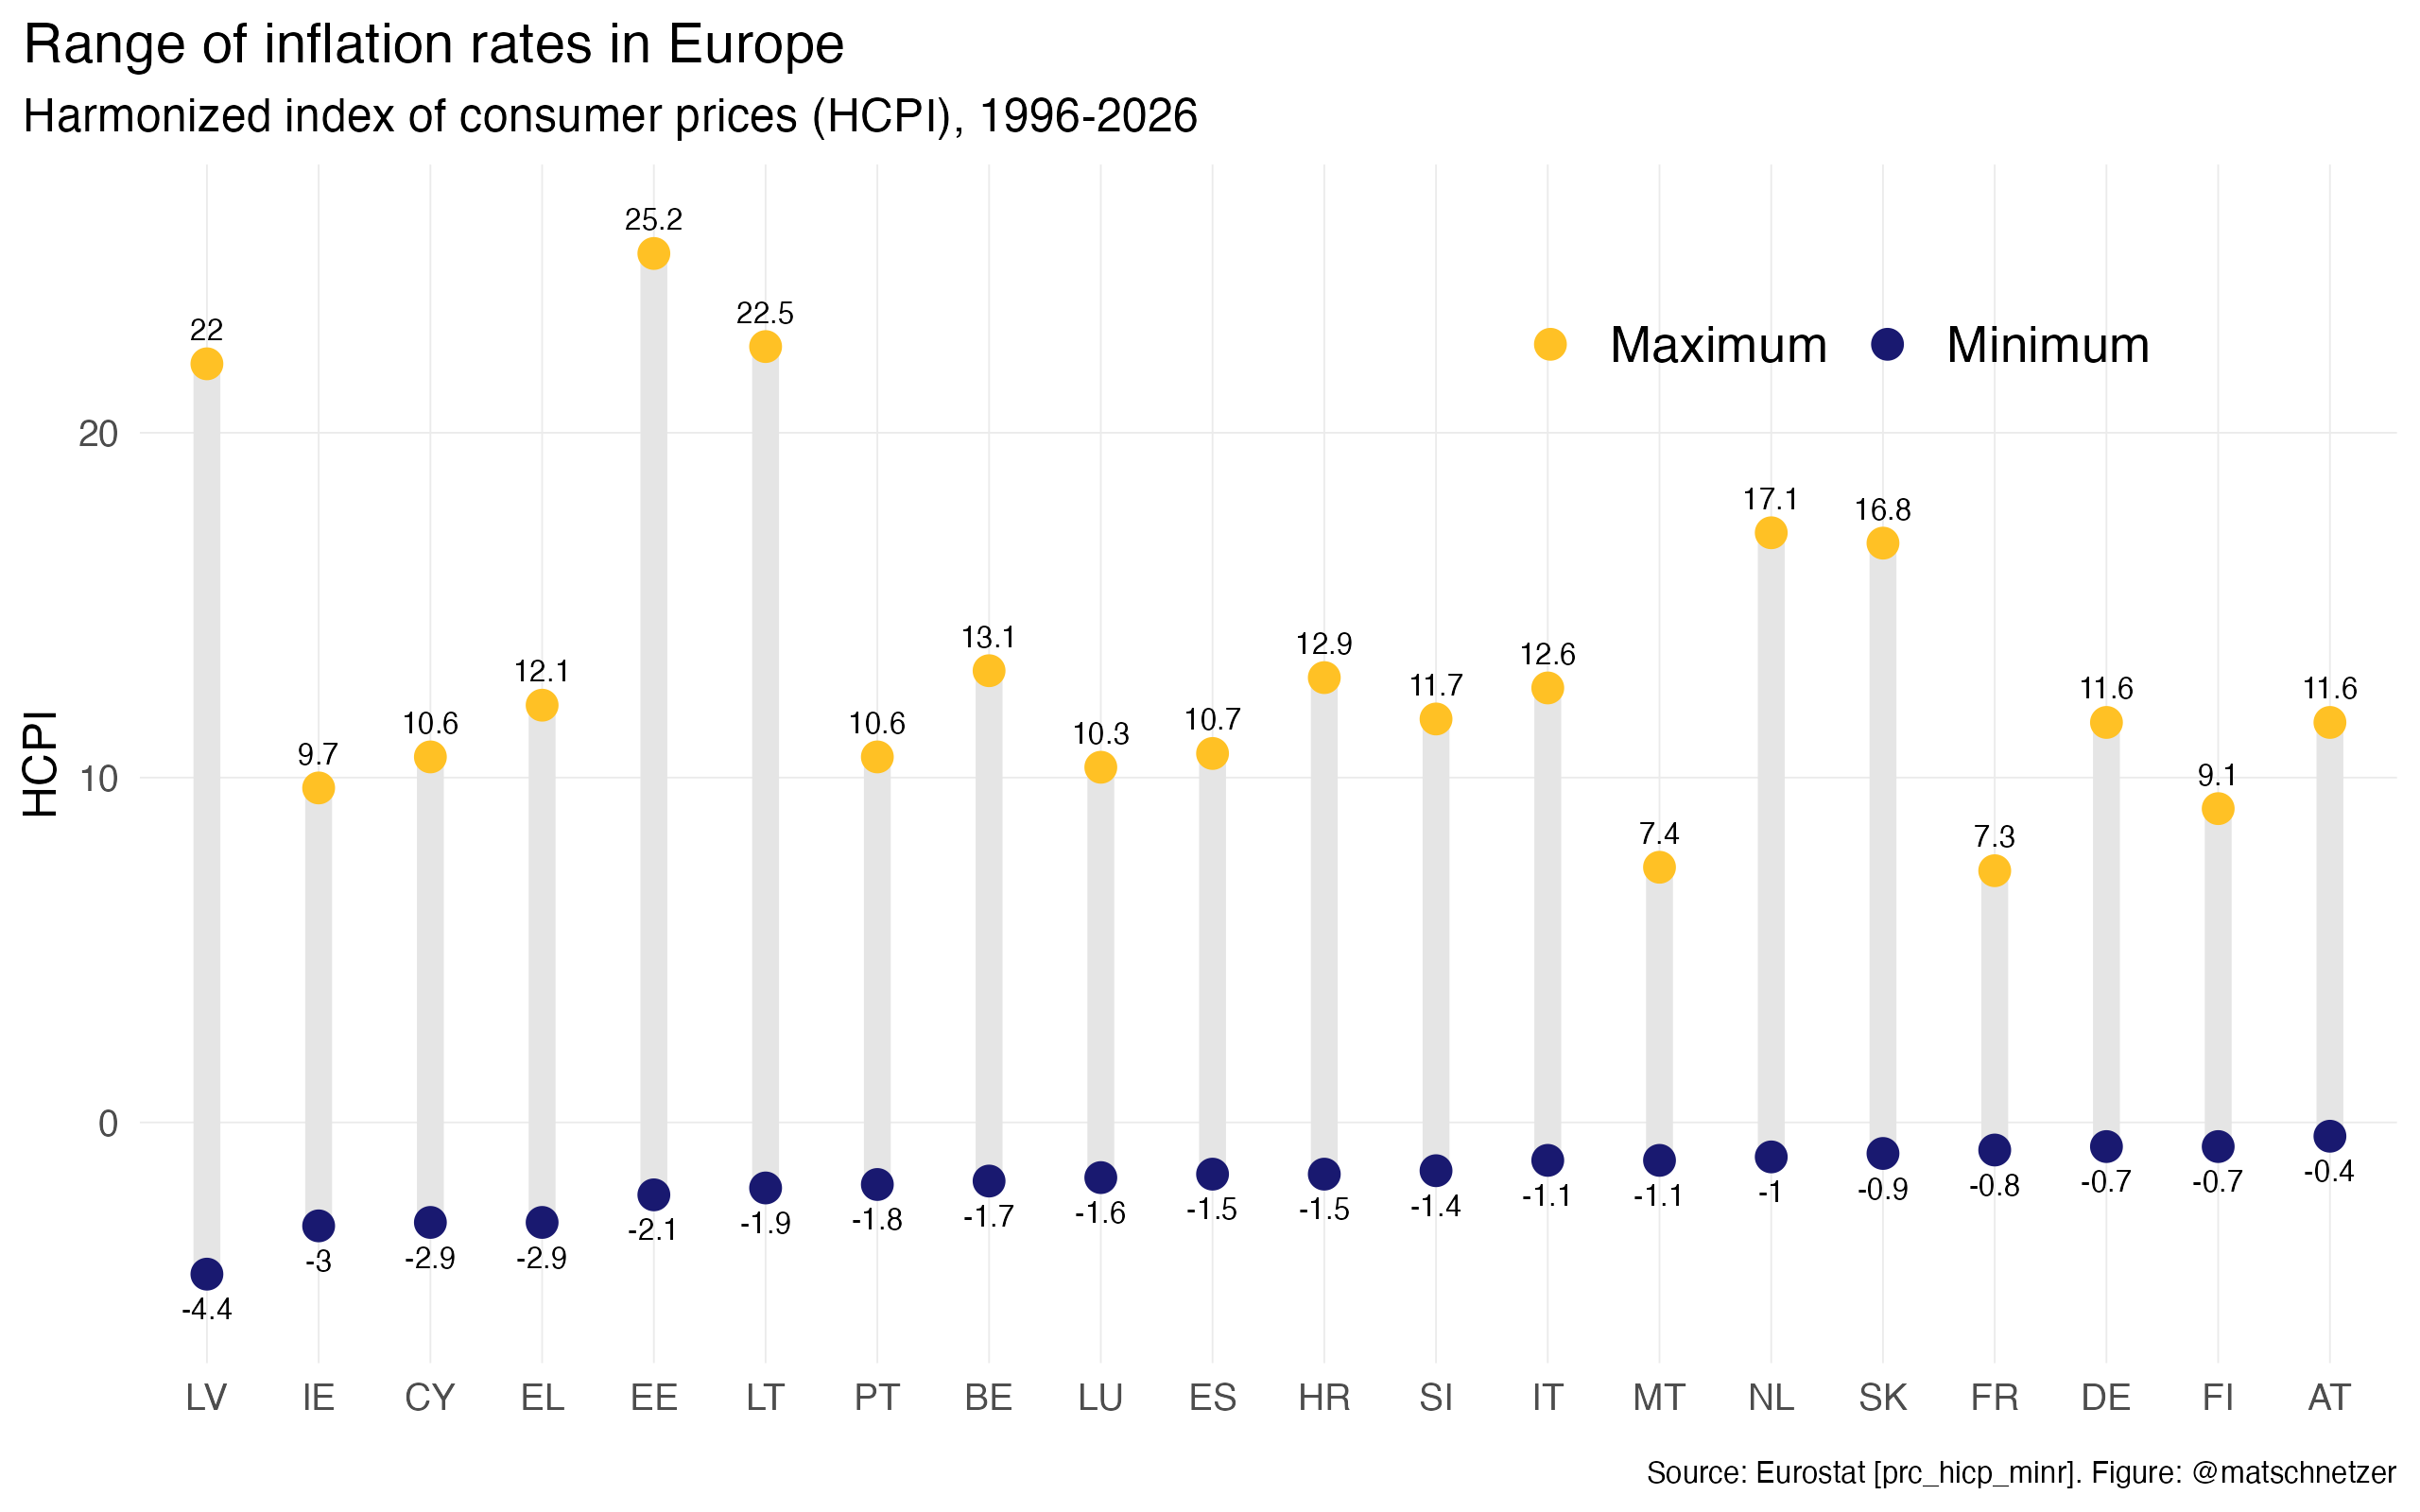
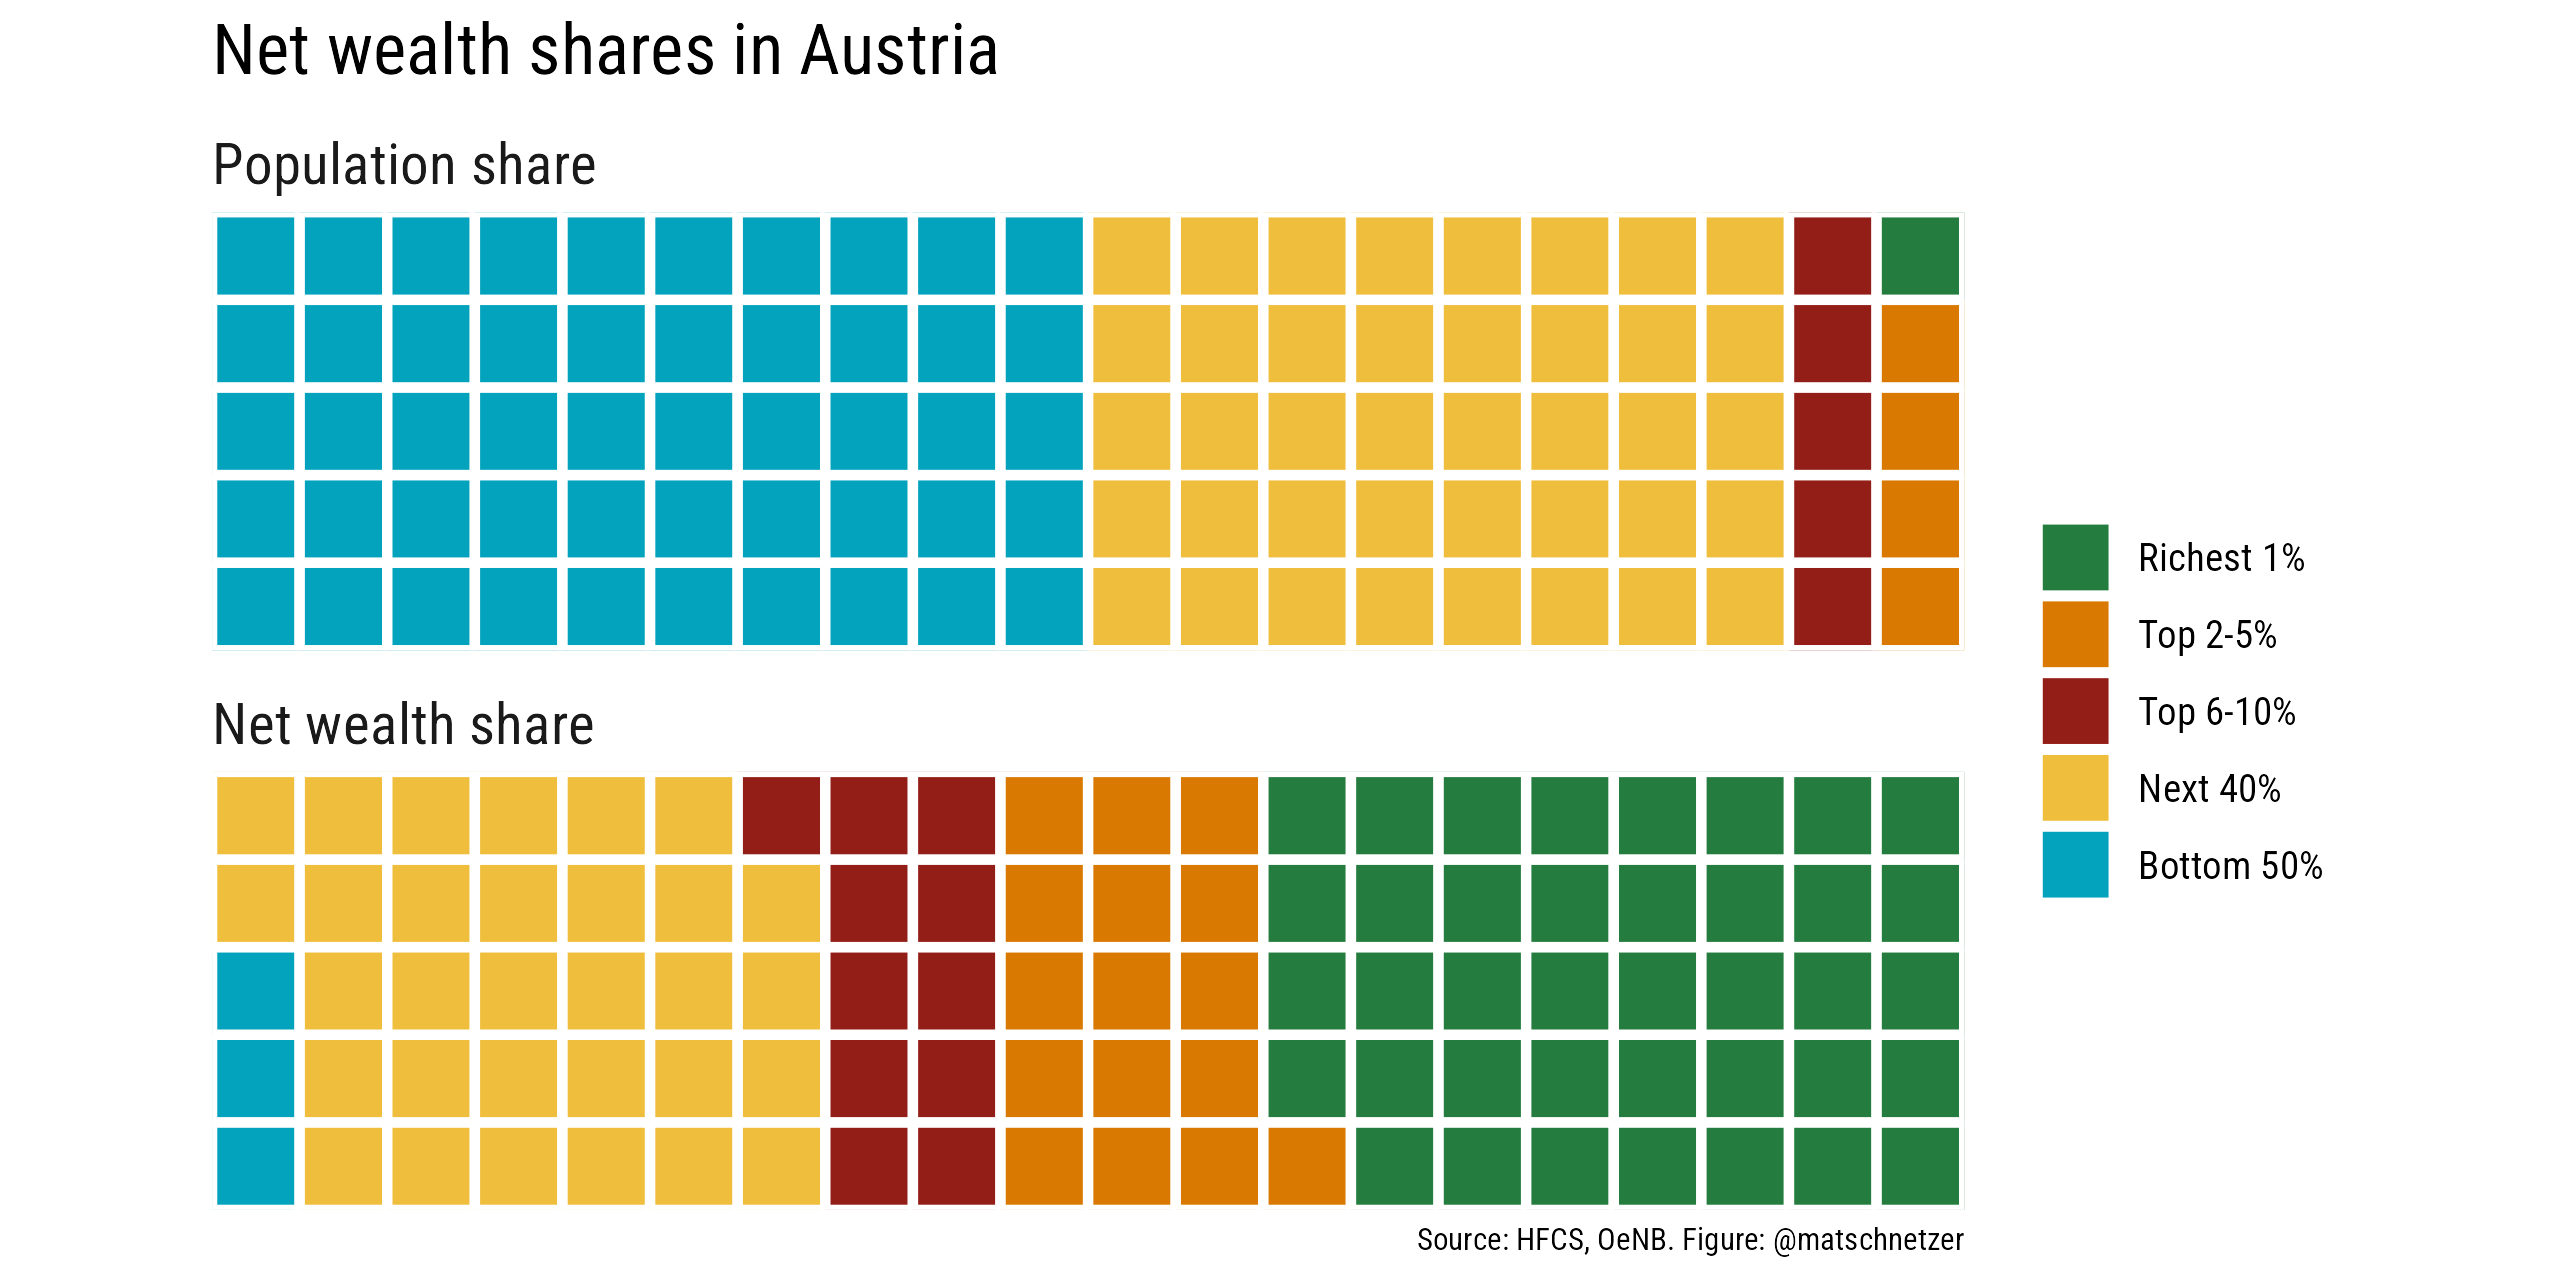
Visualizations by students
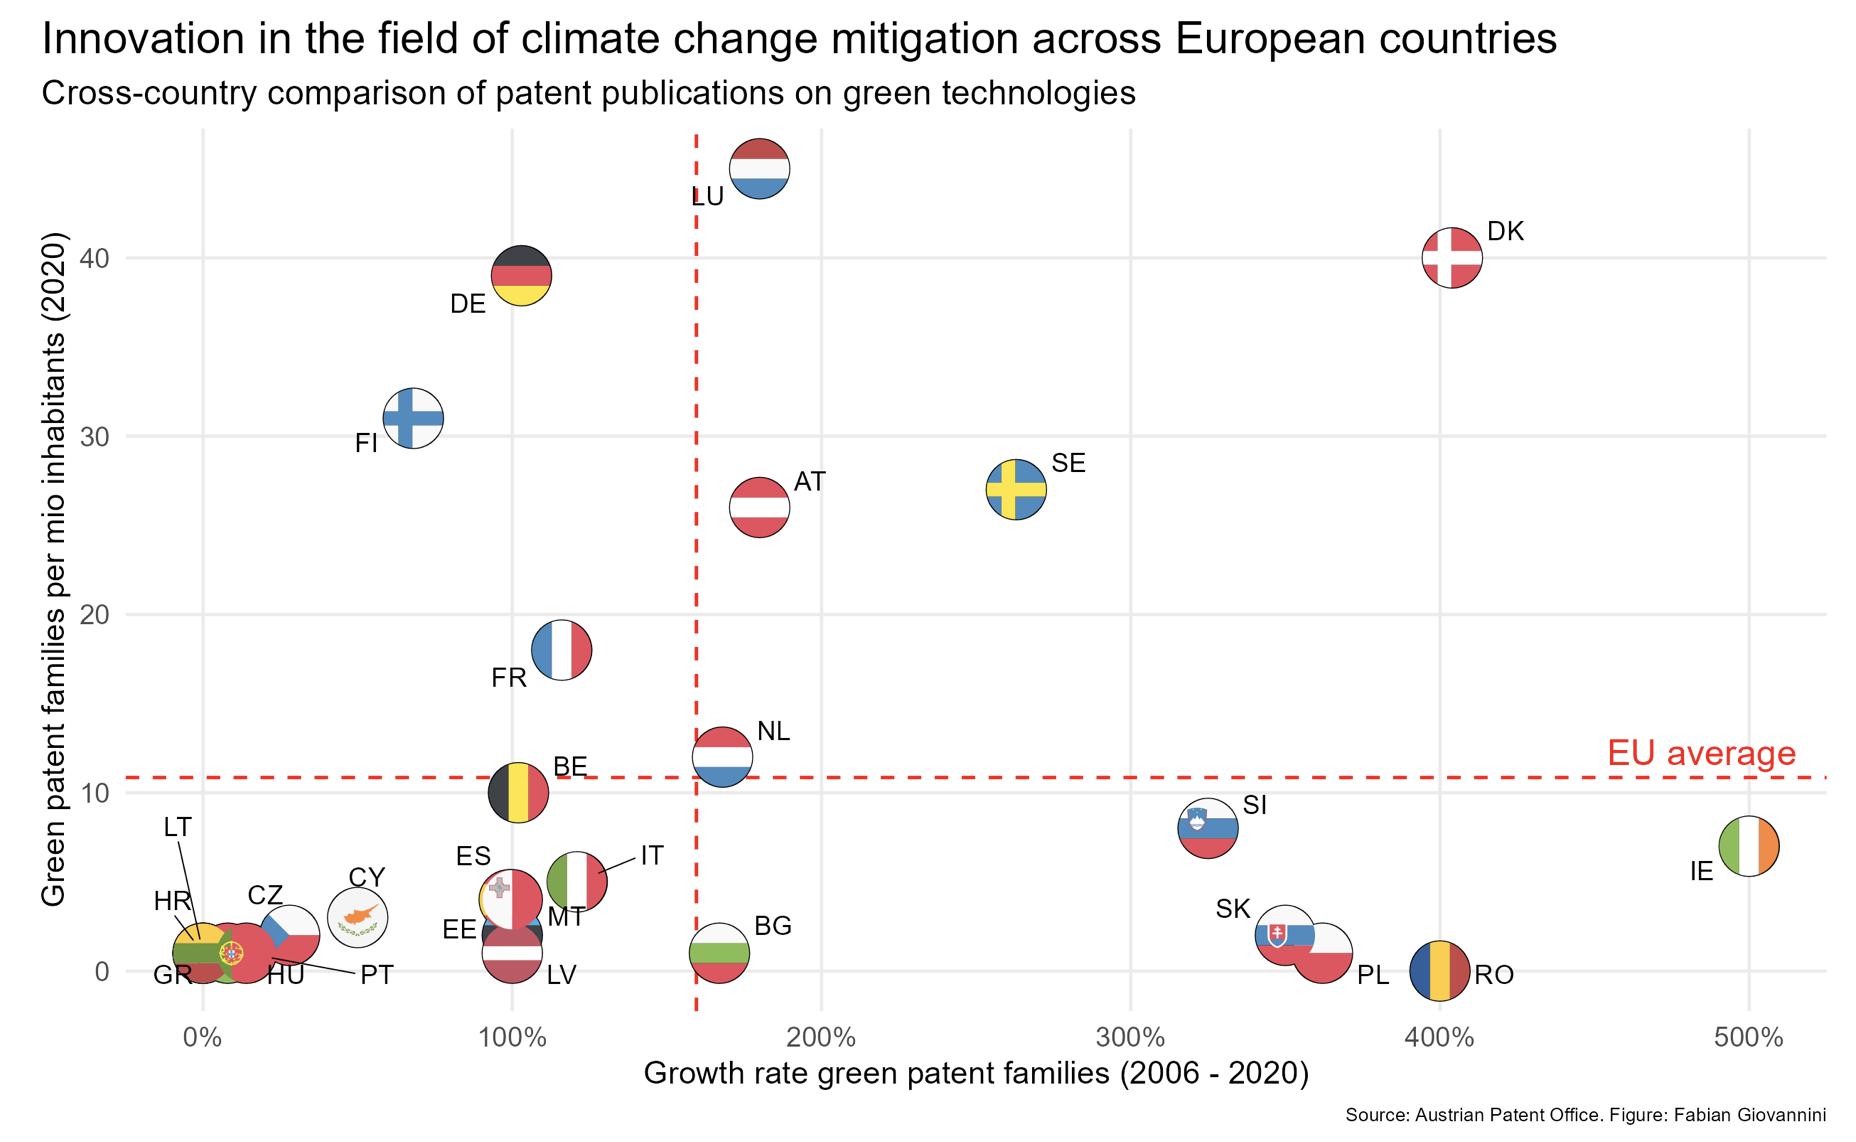
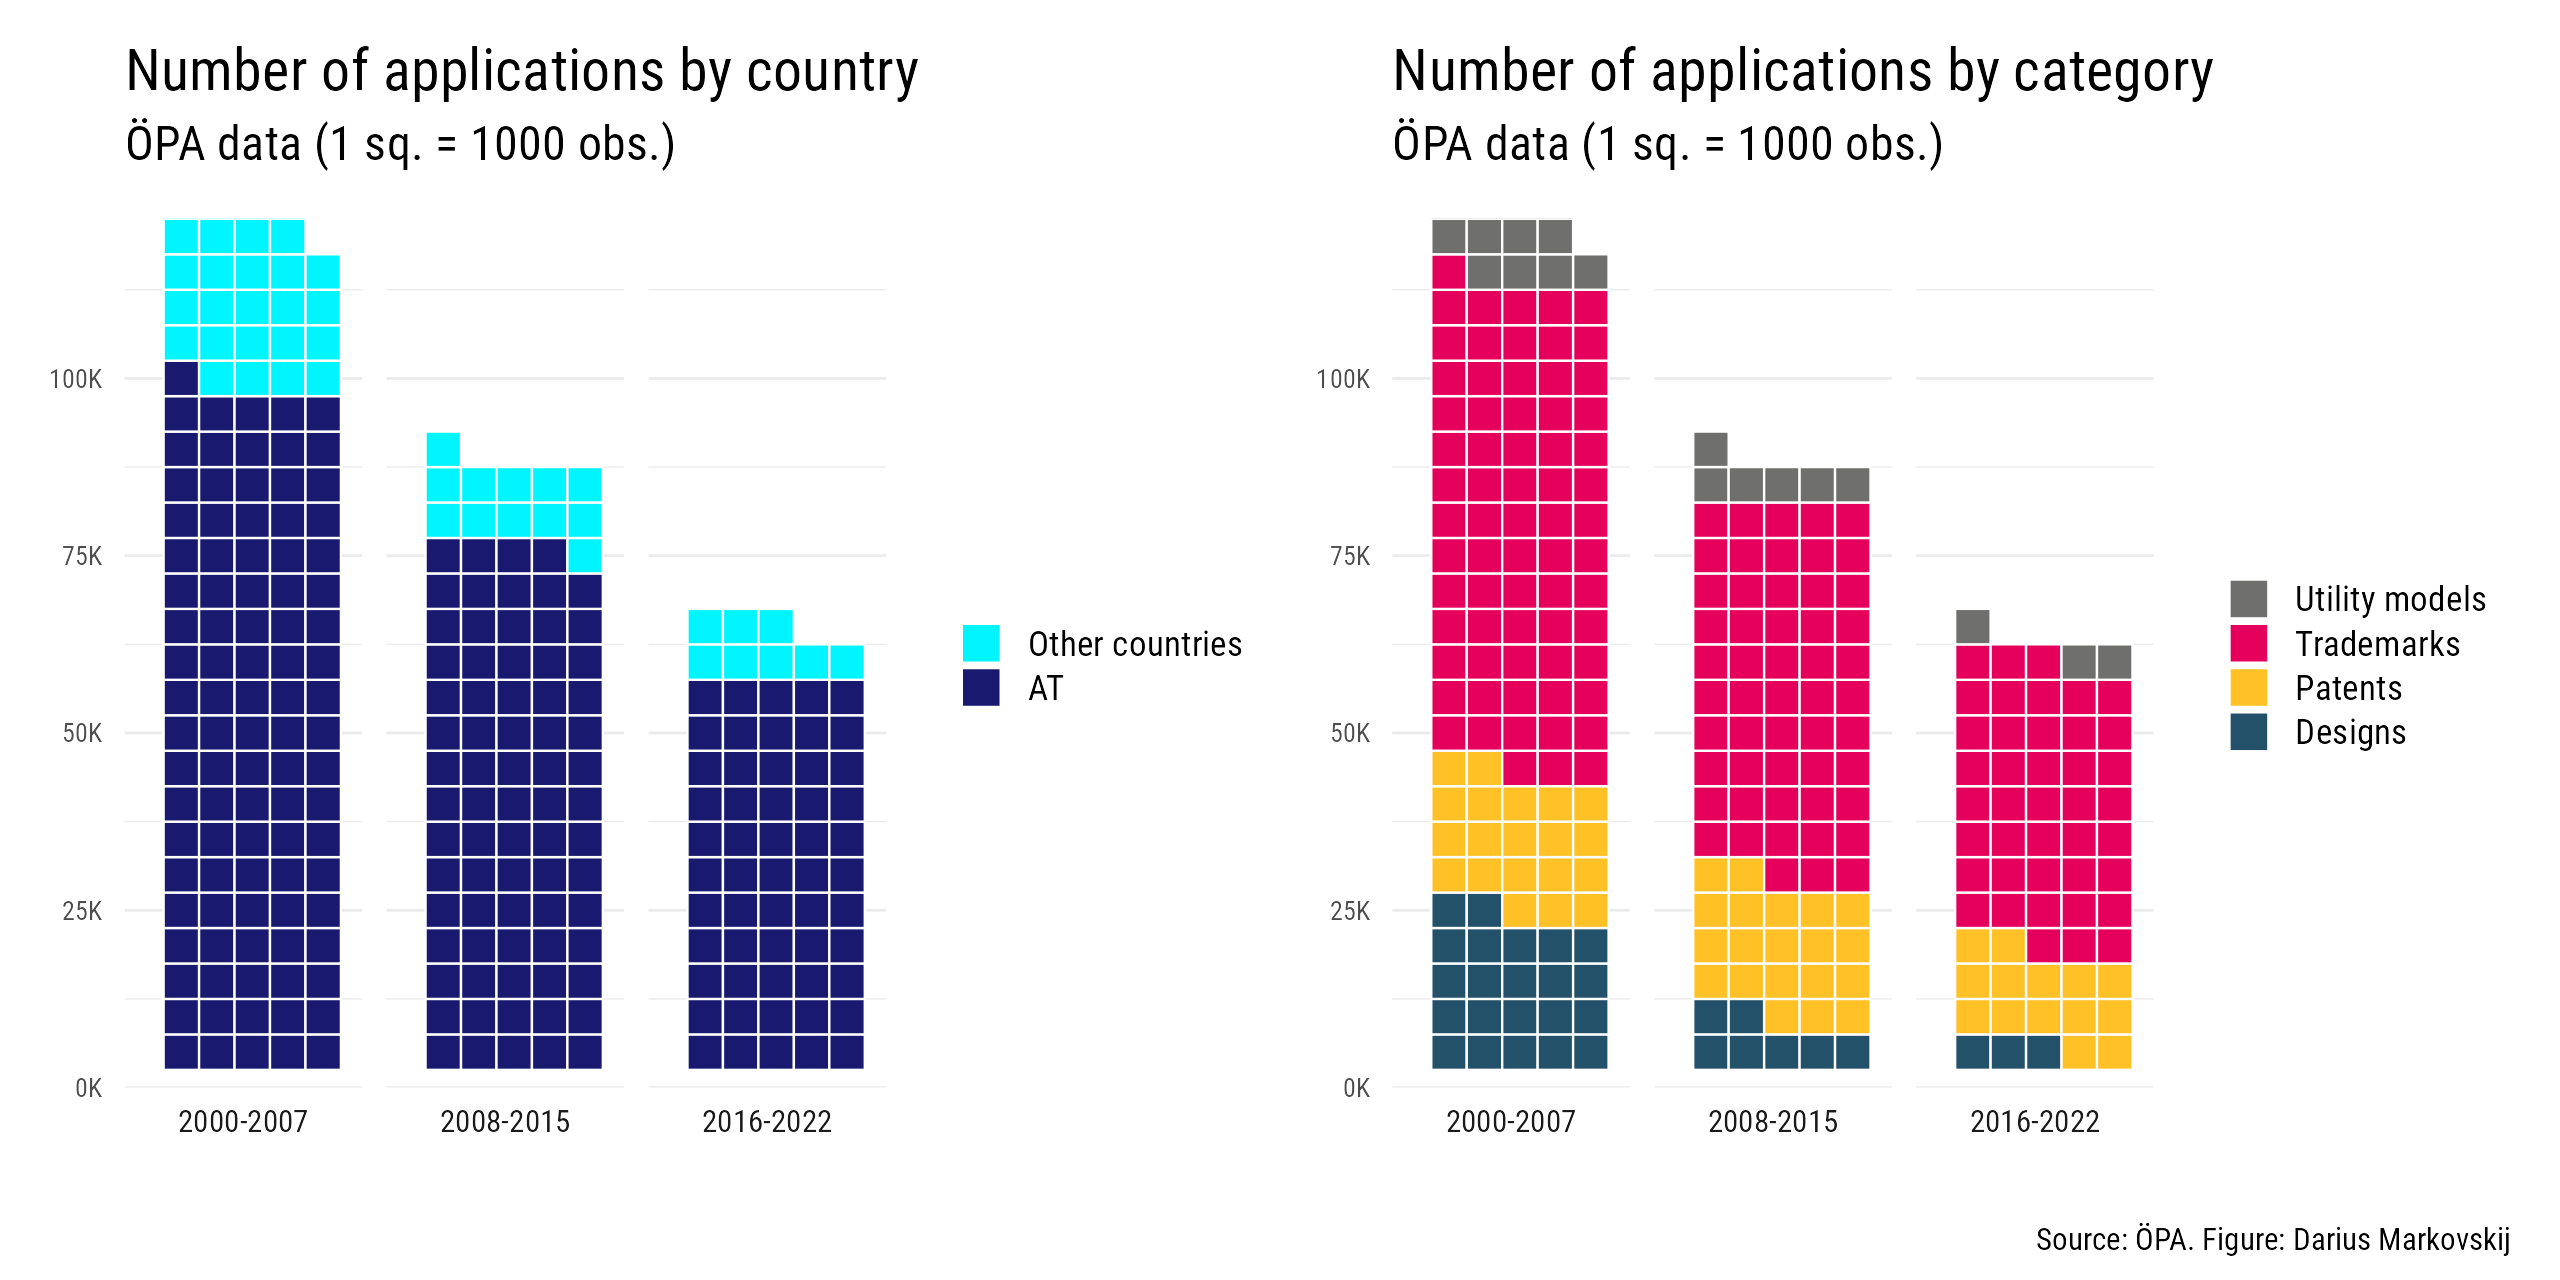
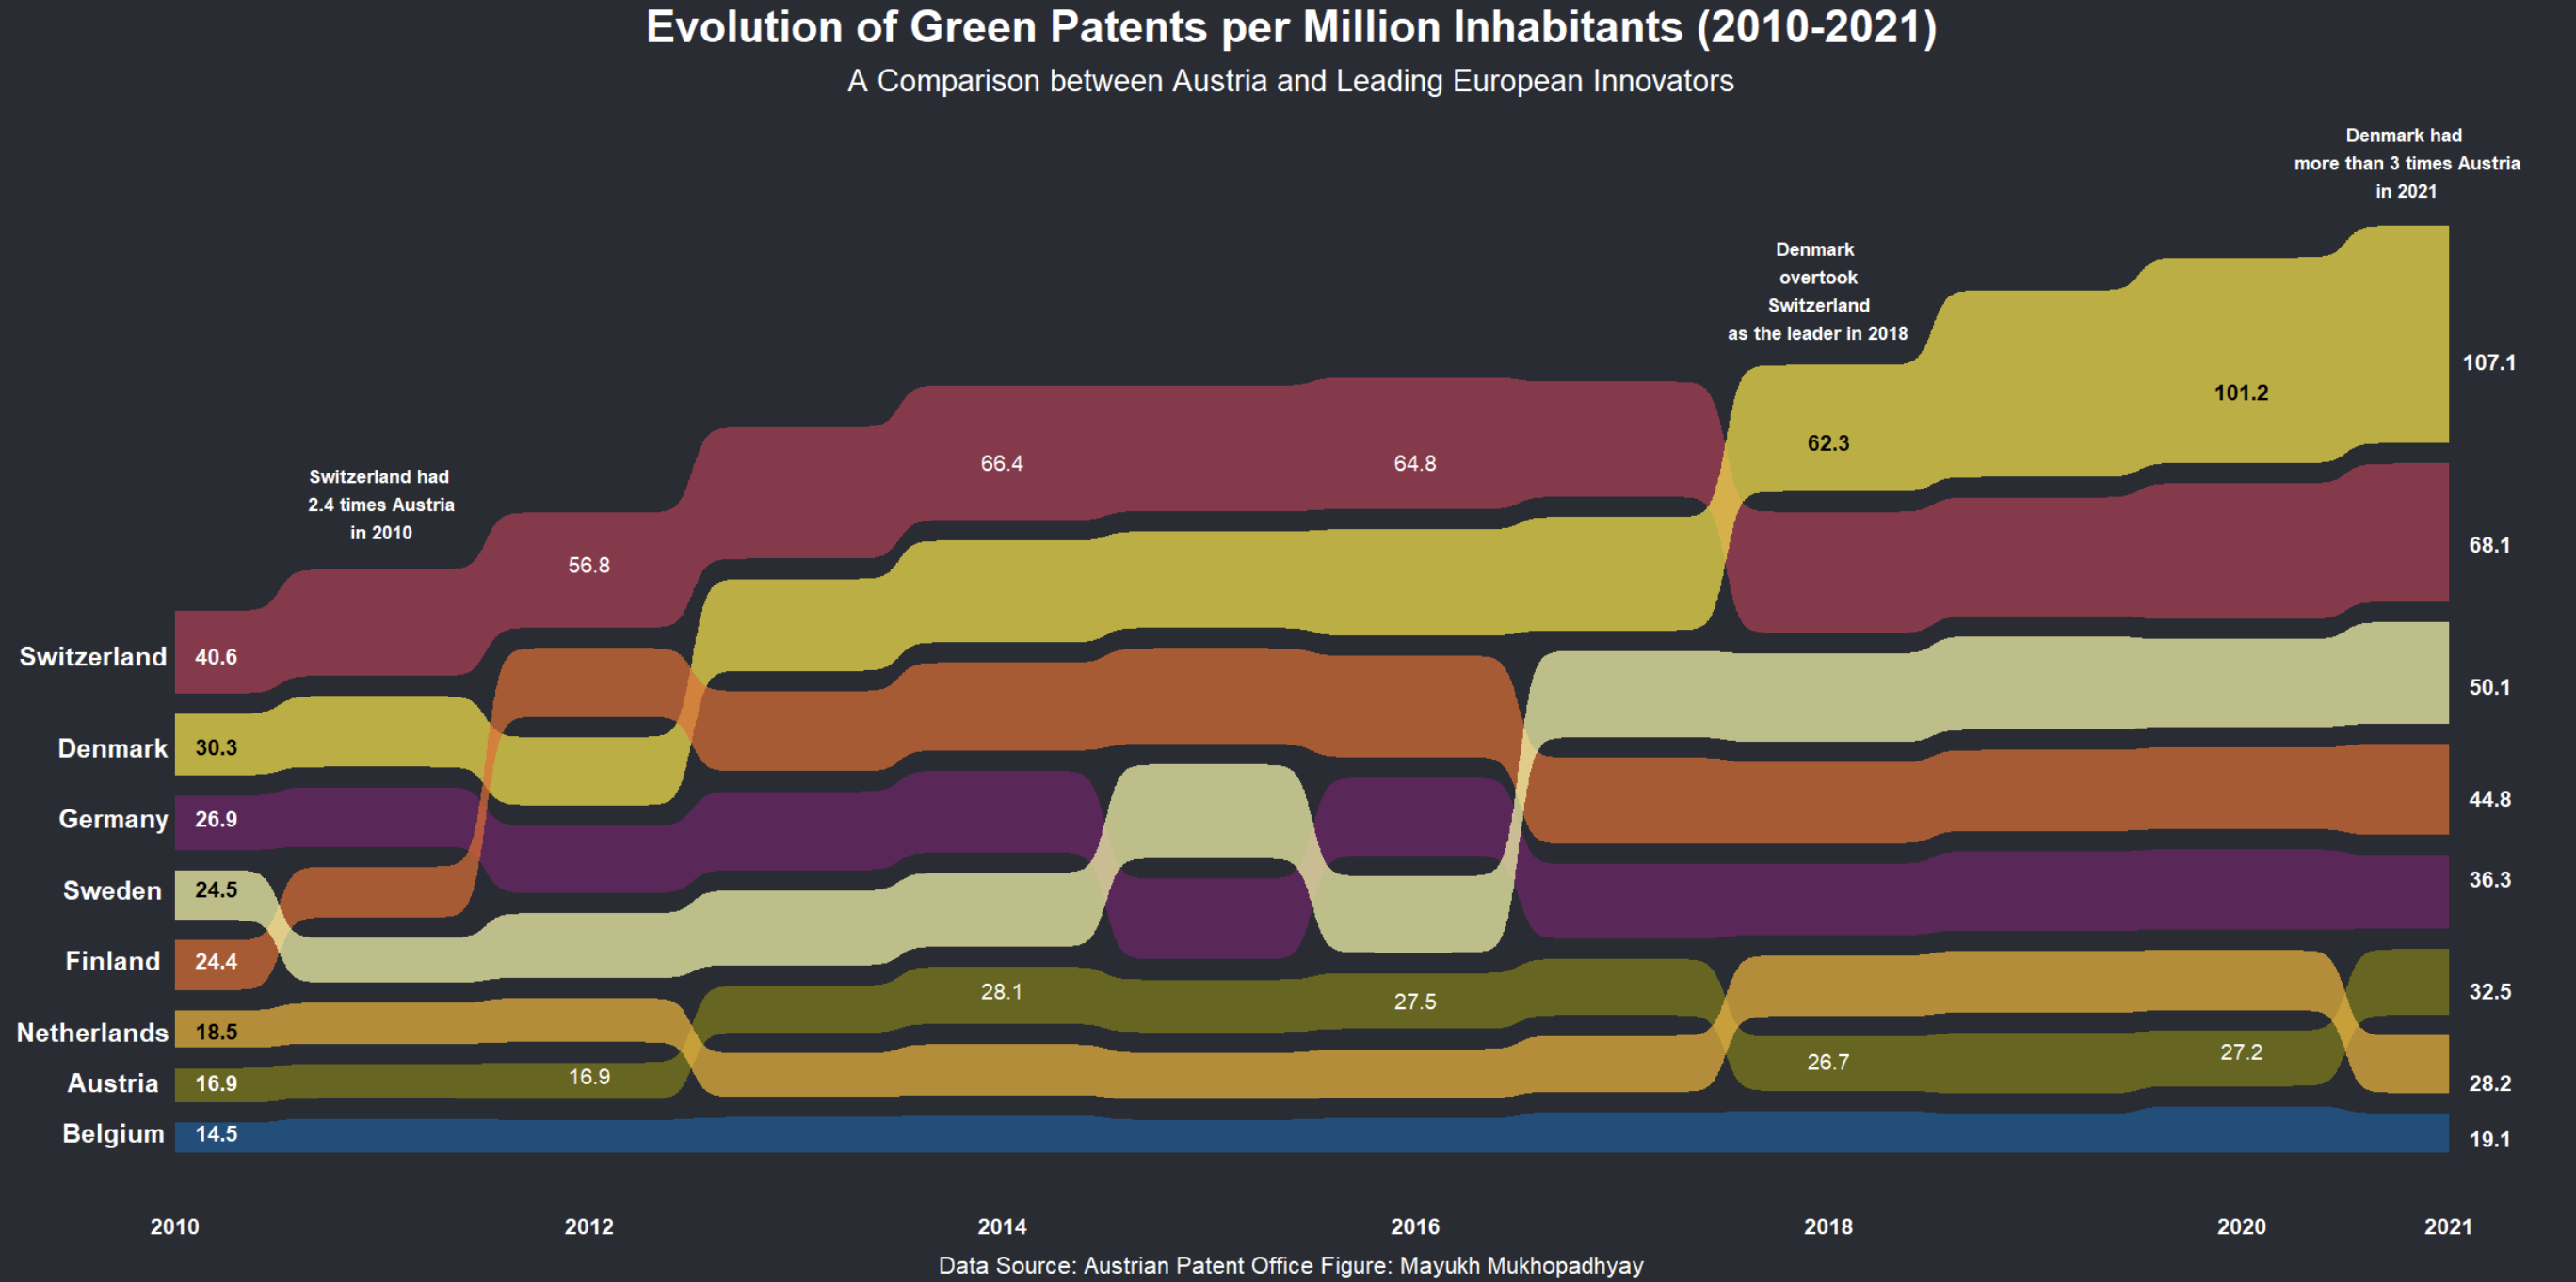
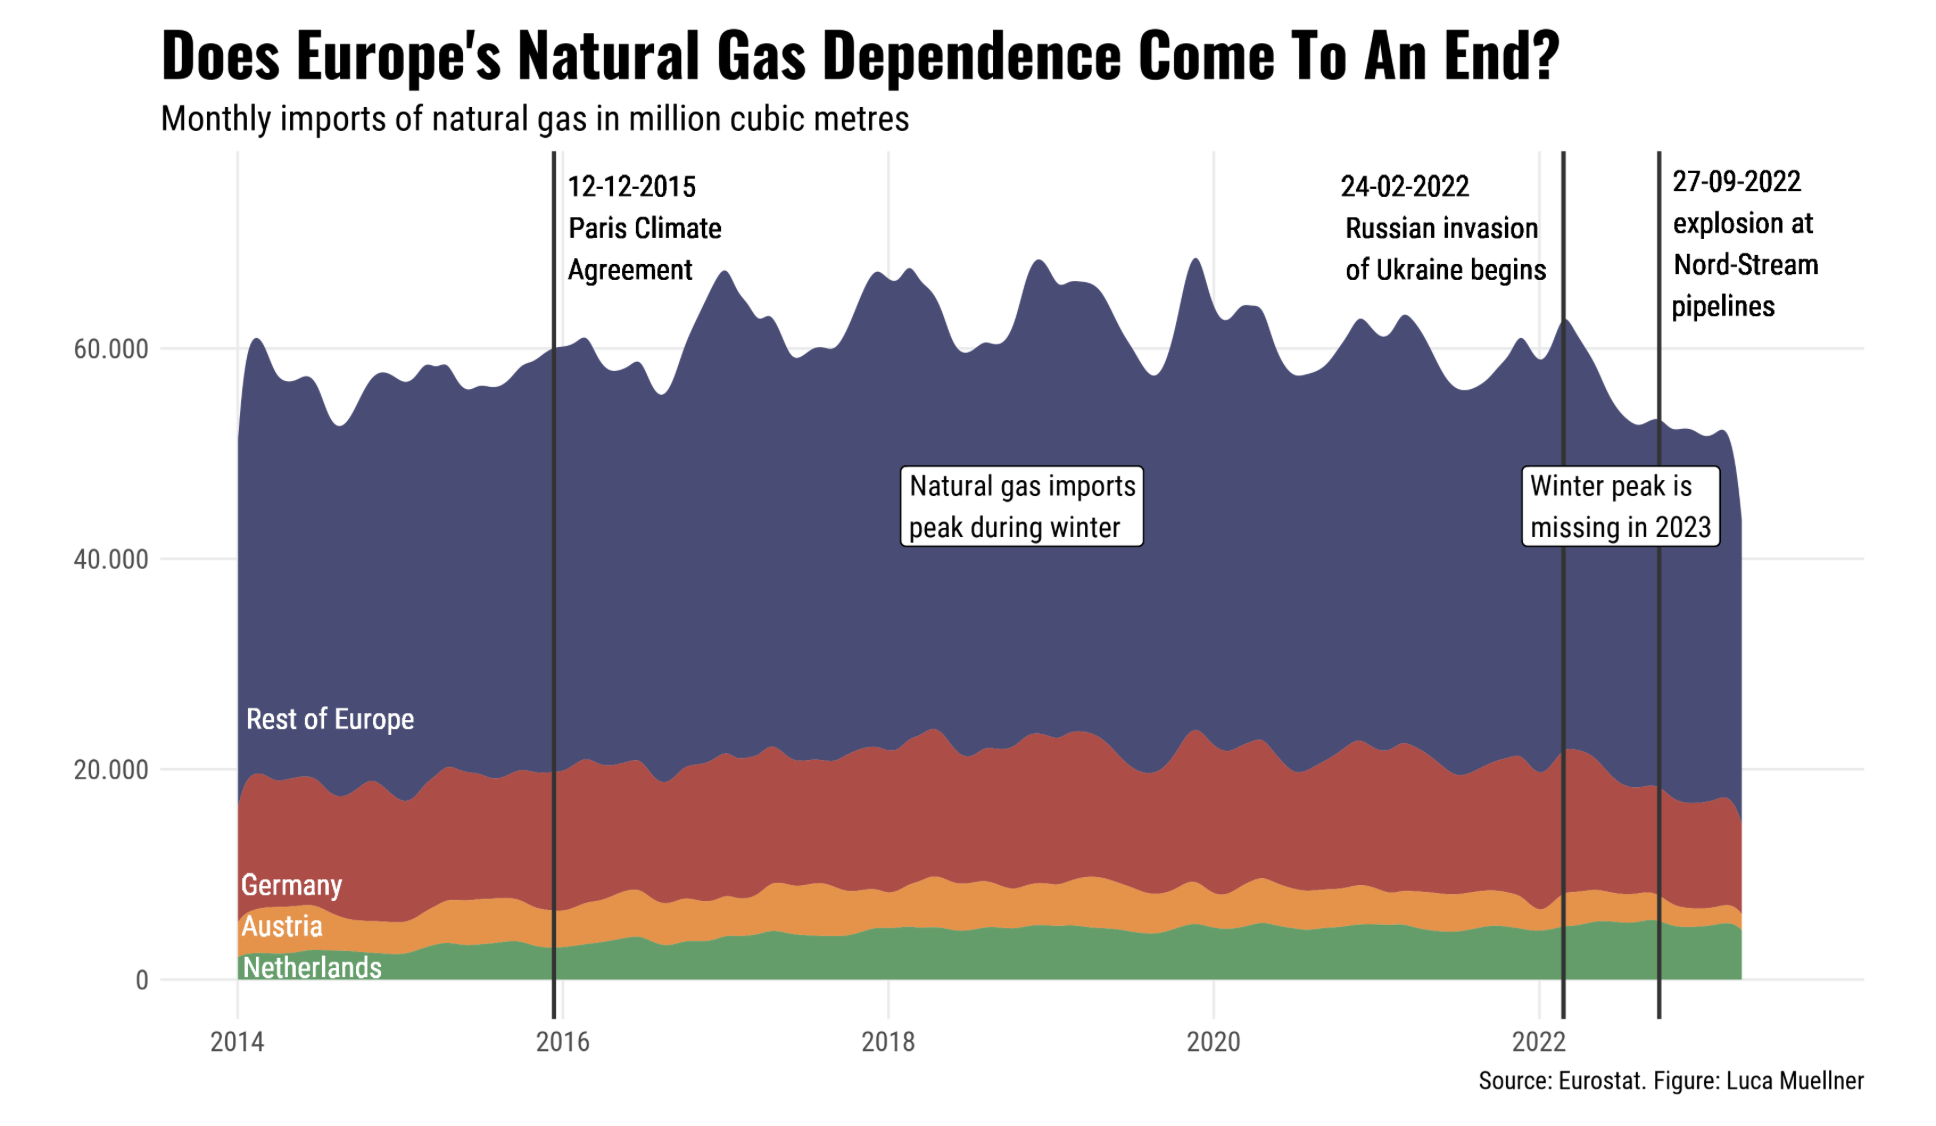
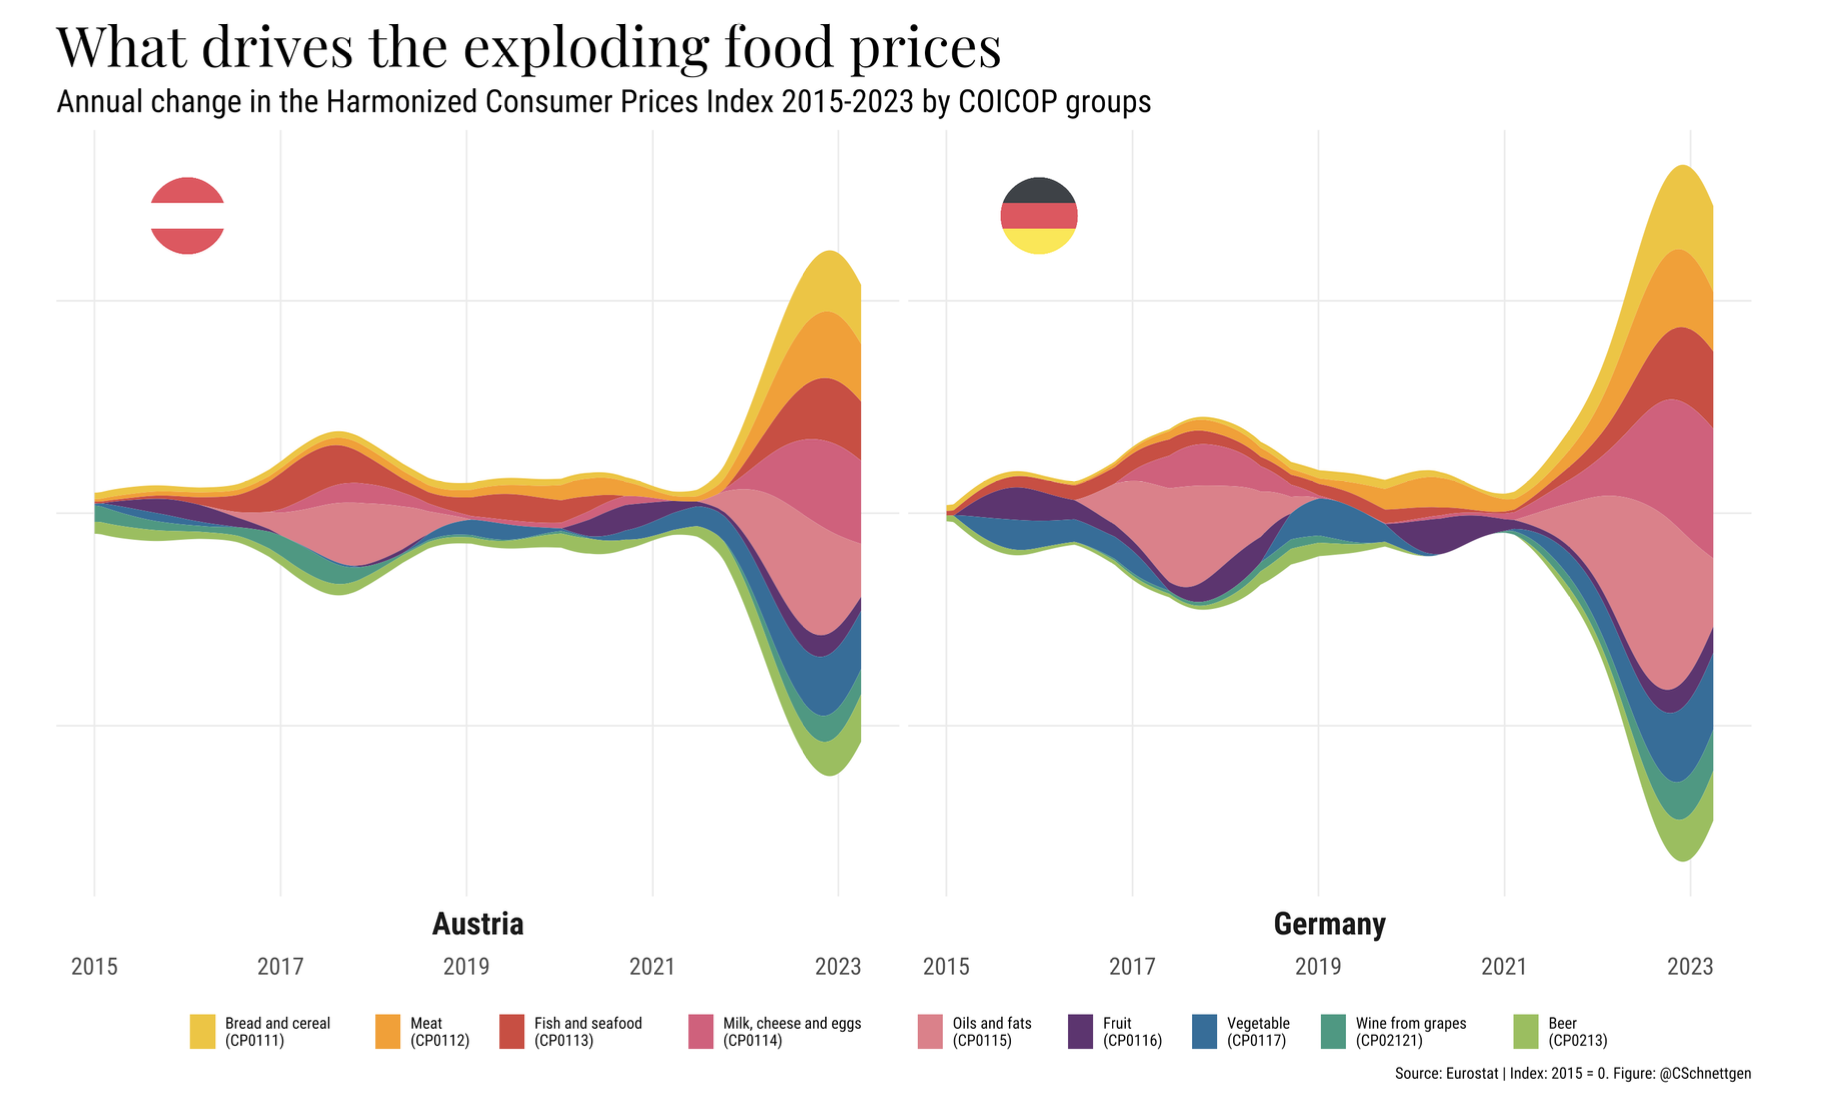
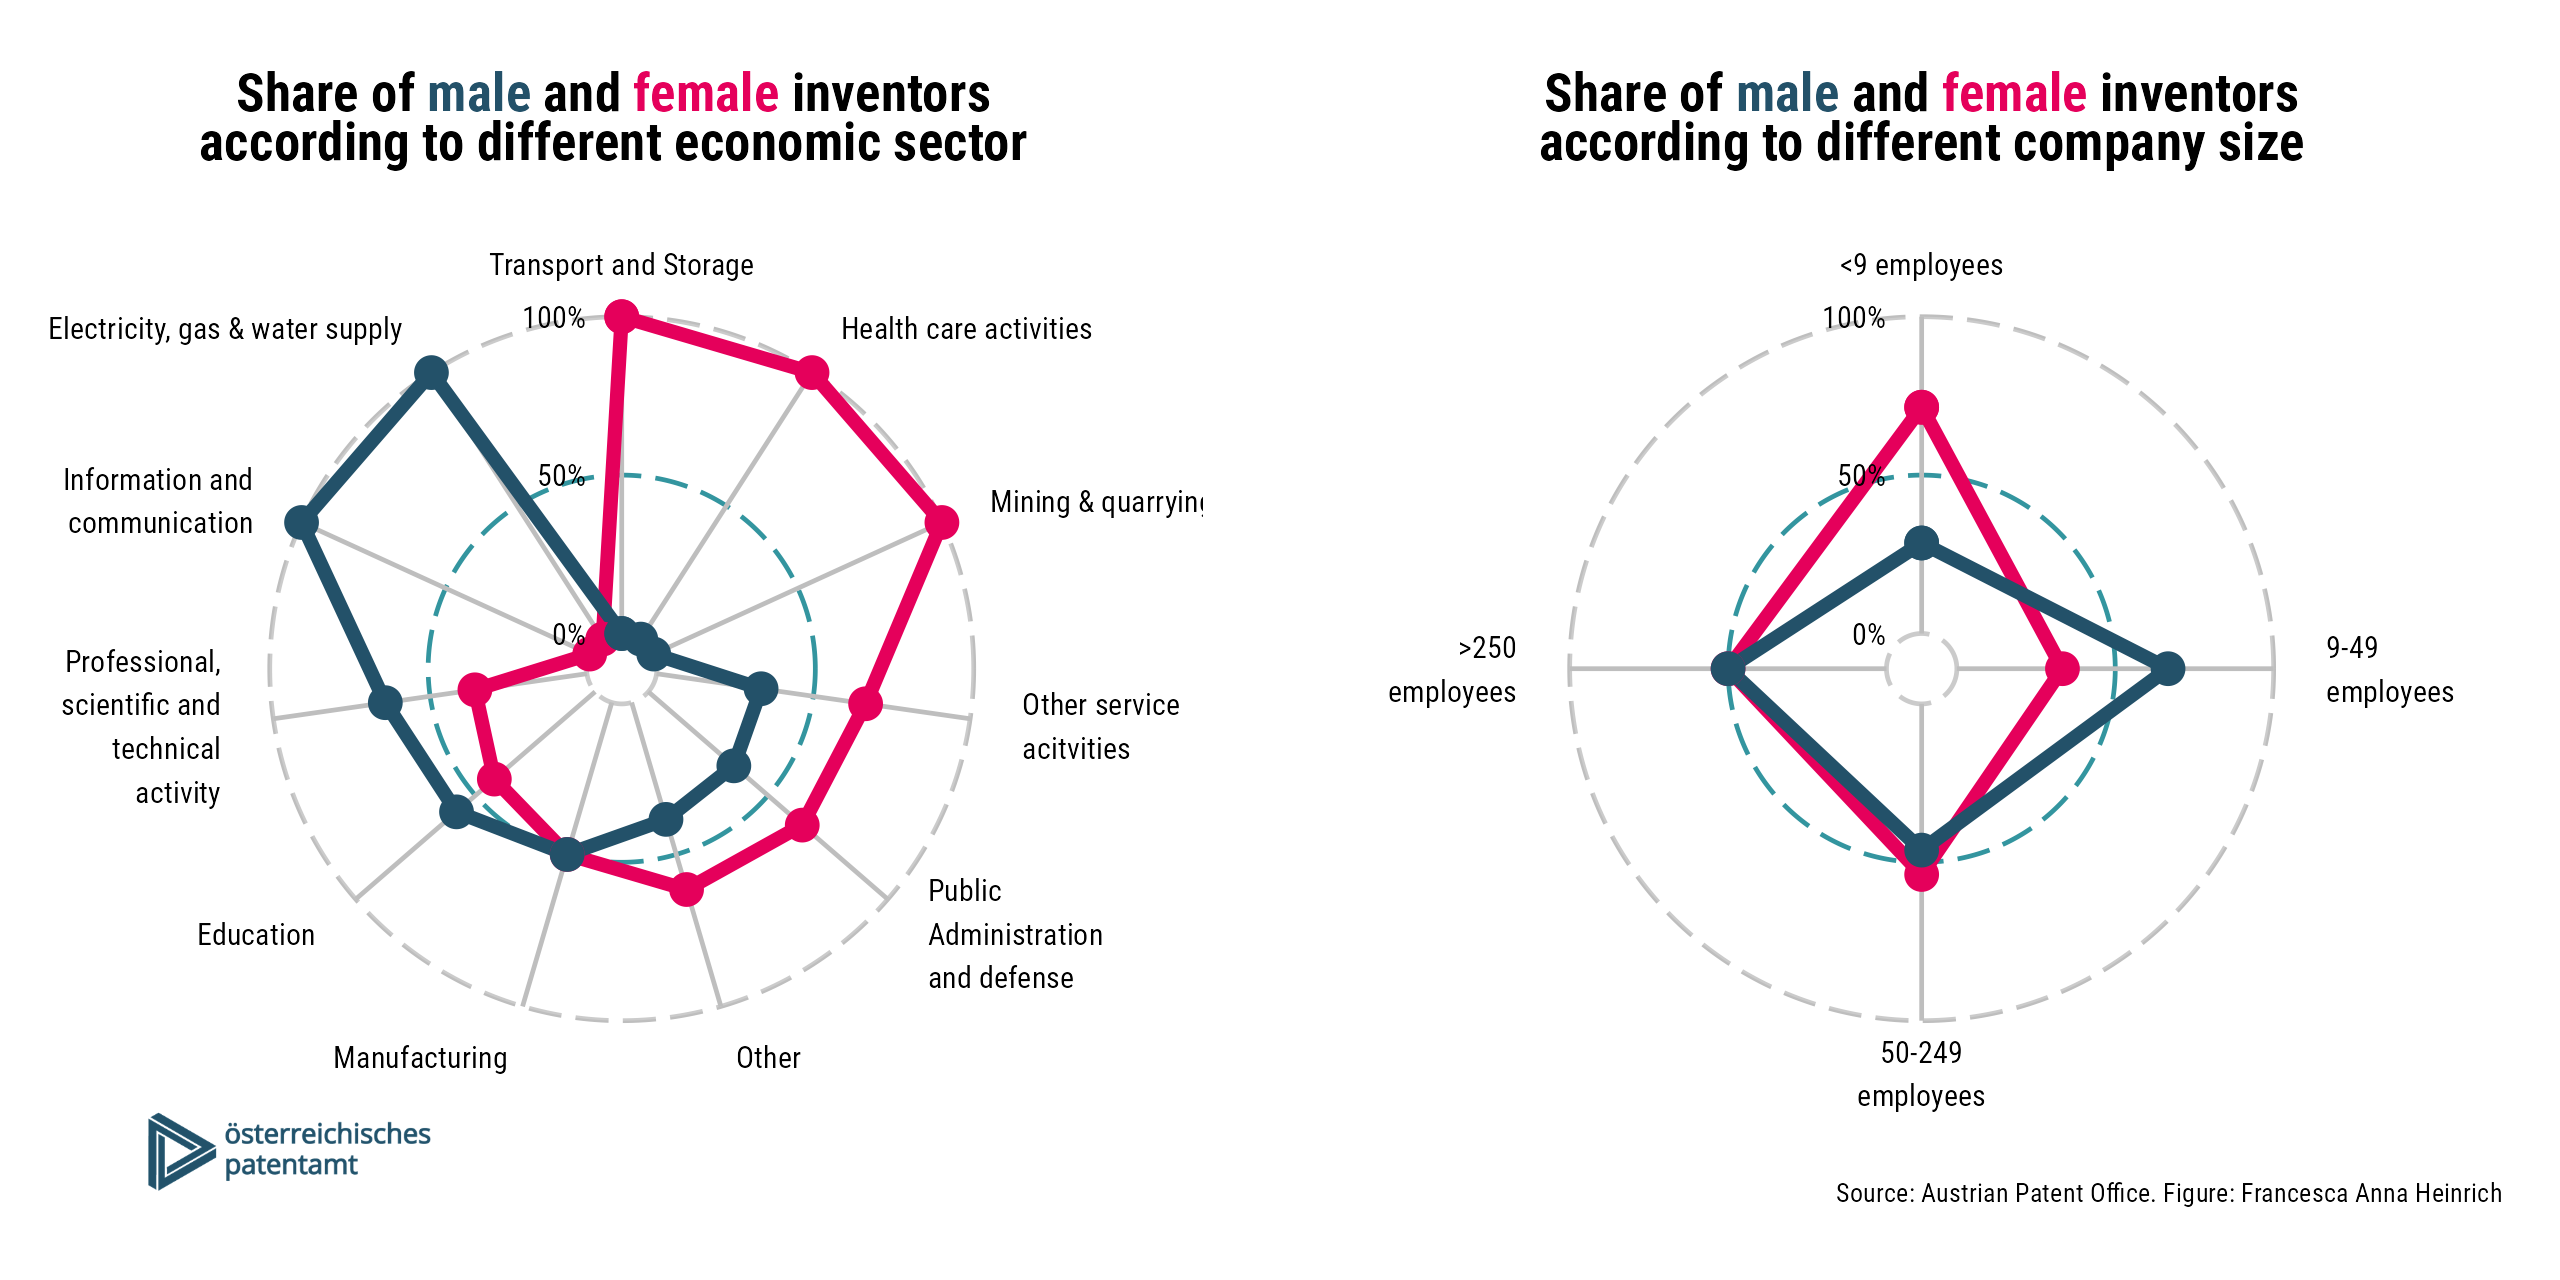
Feedback, cooperation and help
Let us know your feedback on the course anytime. If possible, we will try to incorporate your feedback immediately. At least, we will consider it for future courses.
As some of you might already have advanced coding skills in R, please support each other and collaborate. This does not mean that one person does all the coding and shares with all colleagues. Students should have an intrinsic motivation to improve their coding skills but cooperate to learn from each other.
Please also consult support platforms like Stack Overflow or take a look at the cheatsheets:




Recommended Literature
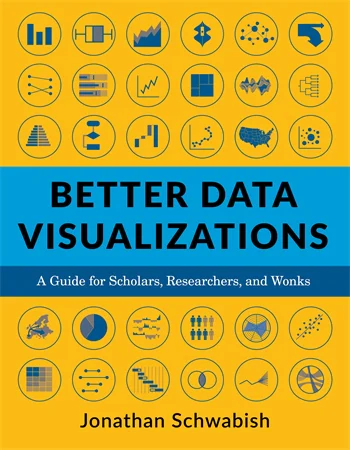 |
Jonathan Schwabish Better Data Visualizations: A Guide for Scholars, Researchers, and Wonks Columbia University Press ISBN-13: 9780231193115 |
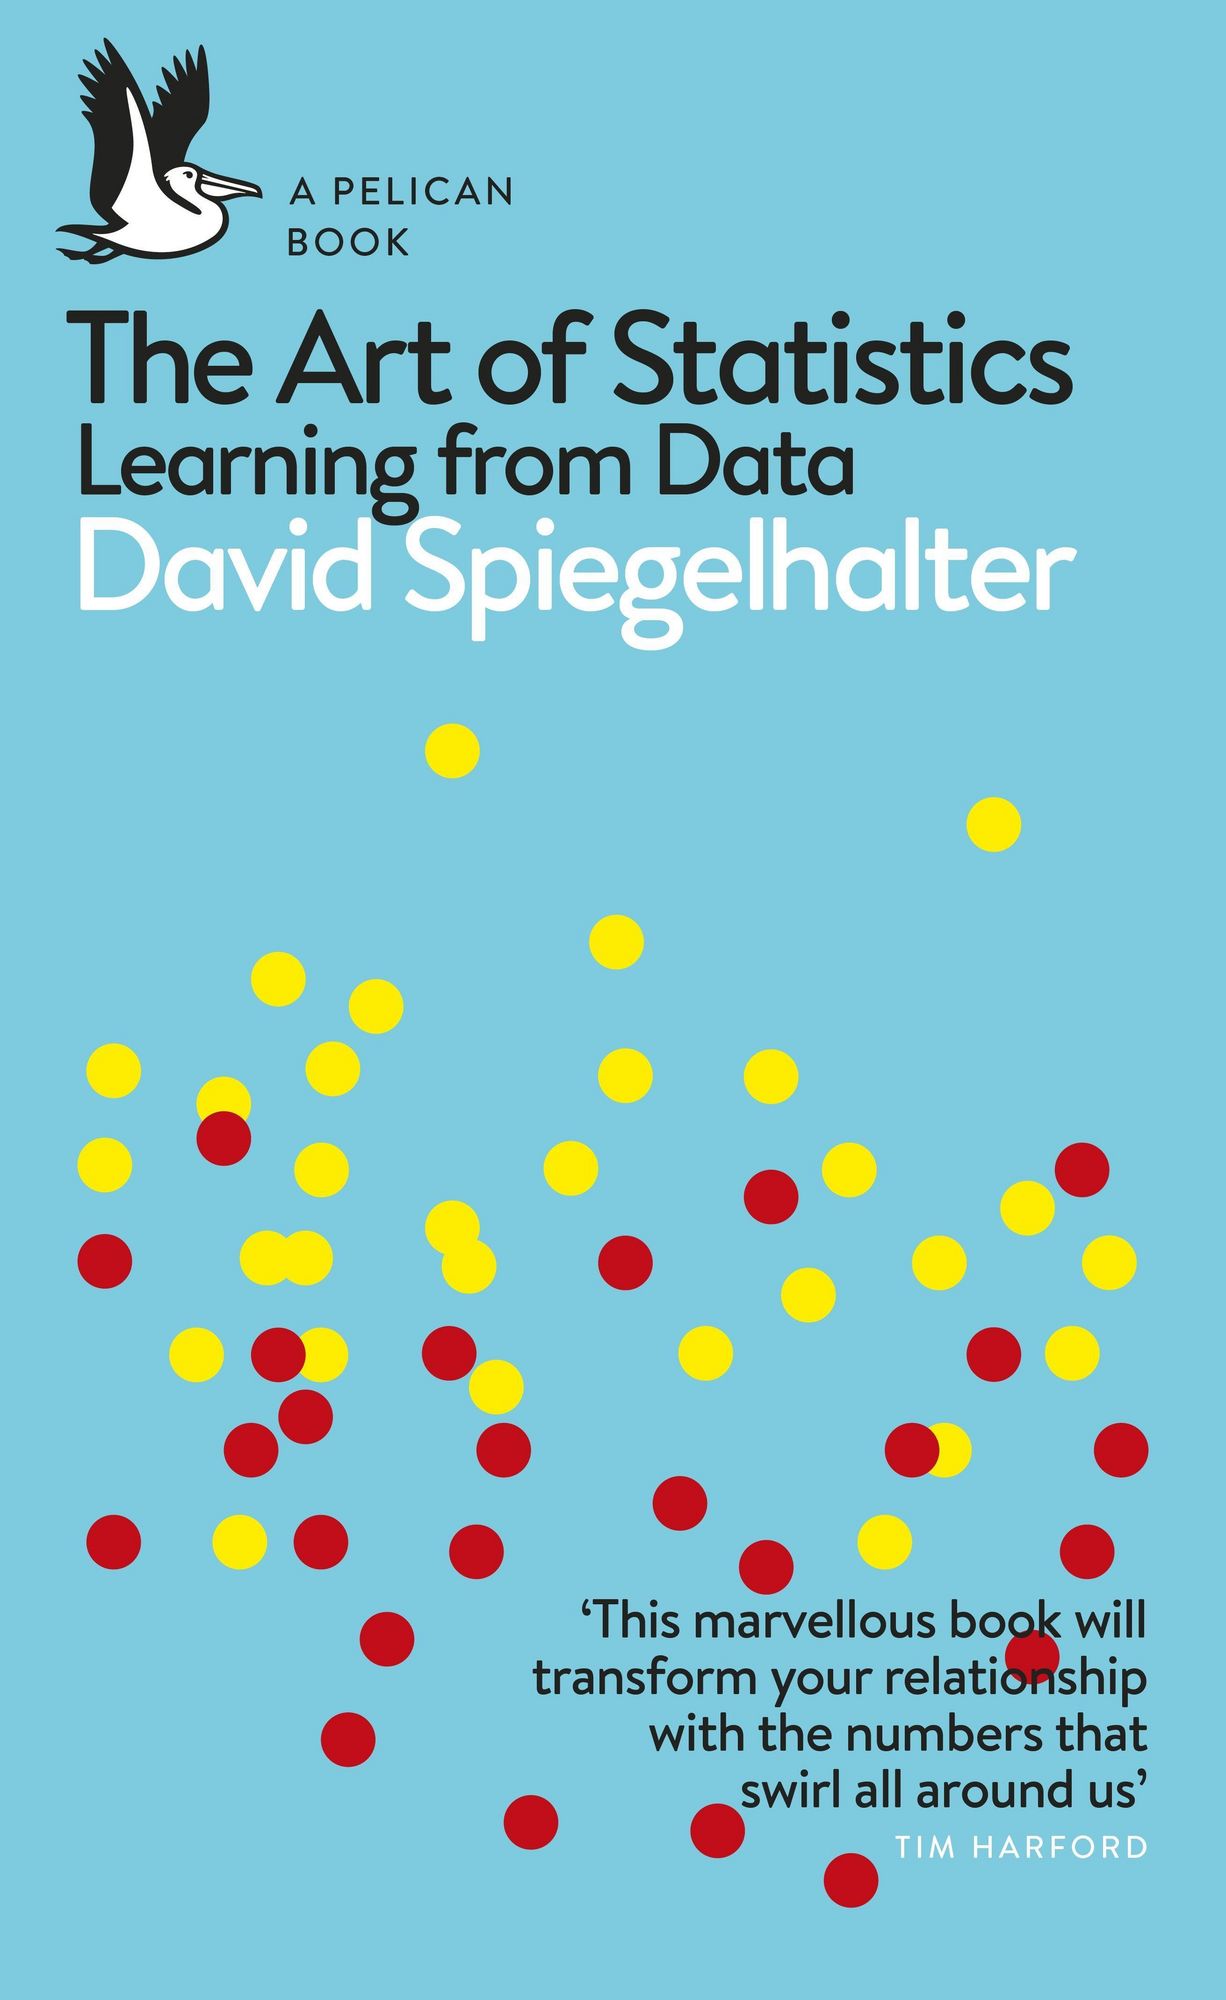 |
David Spiegelhalter The Art of Statistics: Learning from Data Penguin Books UK ISBN-13: 9780241258767 |
Empirical Monetary Policy Research

The era of evidence in economics
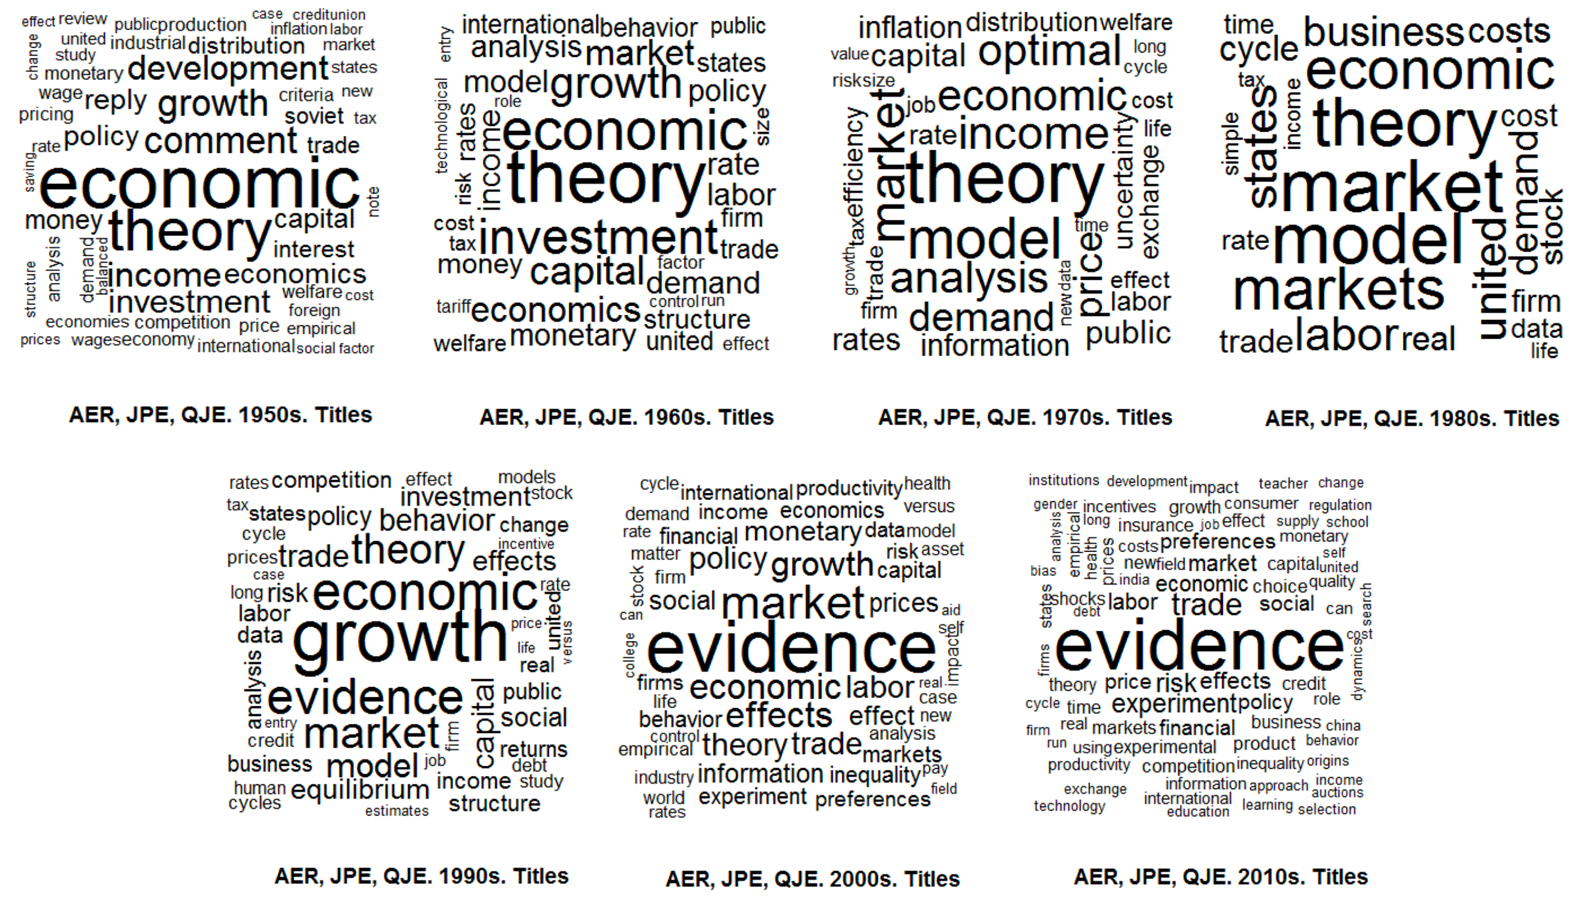
The figure shows the evolution of economics literature by text mining the 500 most-cited titles in top journals by decade. There is a shift from advancing theory towards empirical evidence.
The rise of empirical articles
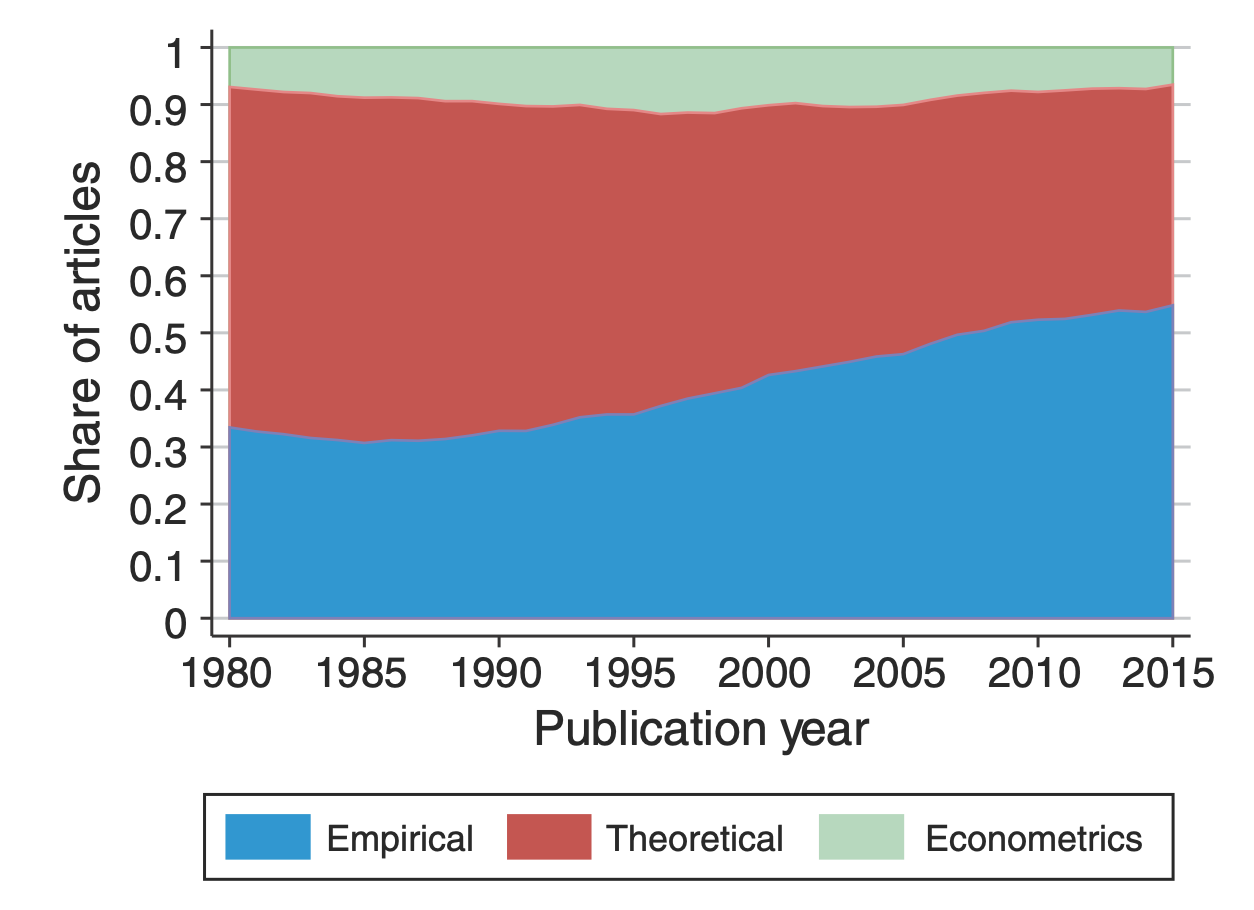 |
There is a distinct rise of empirical papers in economics. In the 1980s, around one third of publications was empirical. Today, it’s more than half. This trend is present in all sub-fields of the discipline (labor, finance, macro, etc.). The analyis is based on 134,892 papers published in 80 journals between 1980 and 2015. Papers are labeled as empirical if they use data to estimate economically meaningful parameters. |
Mind the (data) gap!

The limits of data
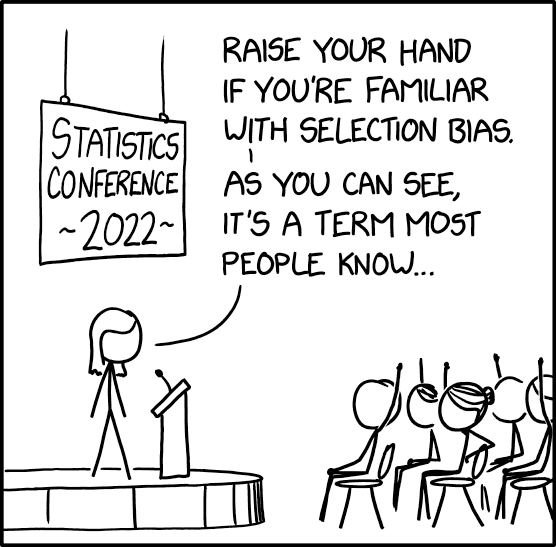
- Data is never a perfect reflection of the world!
- It’s only a subset: not crime but reported crime
- Information is collected by humans and processed by machines: imprecisions and errors are inevitable!
- Be aware of potential (cognitive and statistical) biases!
Invisible women
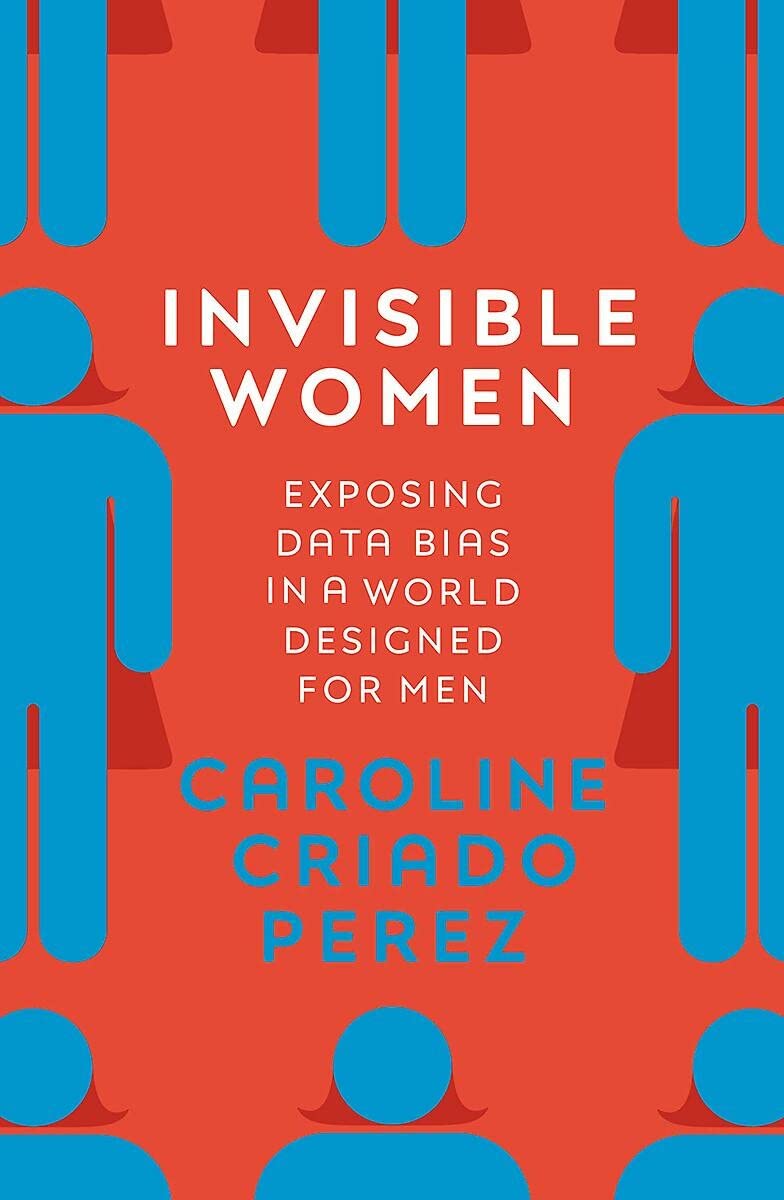 |
Caroline Criado Perez Exposing Data Bias in a World Designed for Men Random House Uk ISBN: 978-1-78470-628-9 The world we live in is built around male data, preferences, and assumptions. There are numerous examples of how the gender data gap has led to women being overlooked and undervalued in areas ranging from medicine to urban planning. To create a more just and equal society, we need to take into account the different experiences and needs of women and other marginalized groups in our data collection and decision-making processes. |
Invisible rich
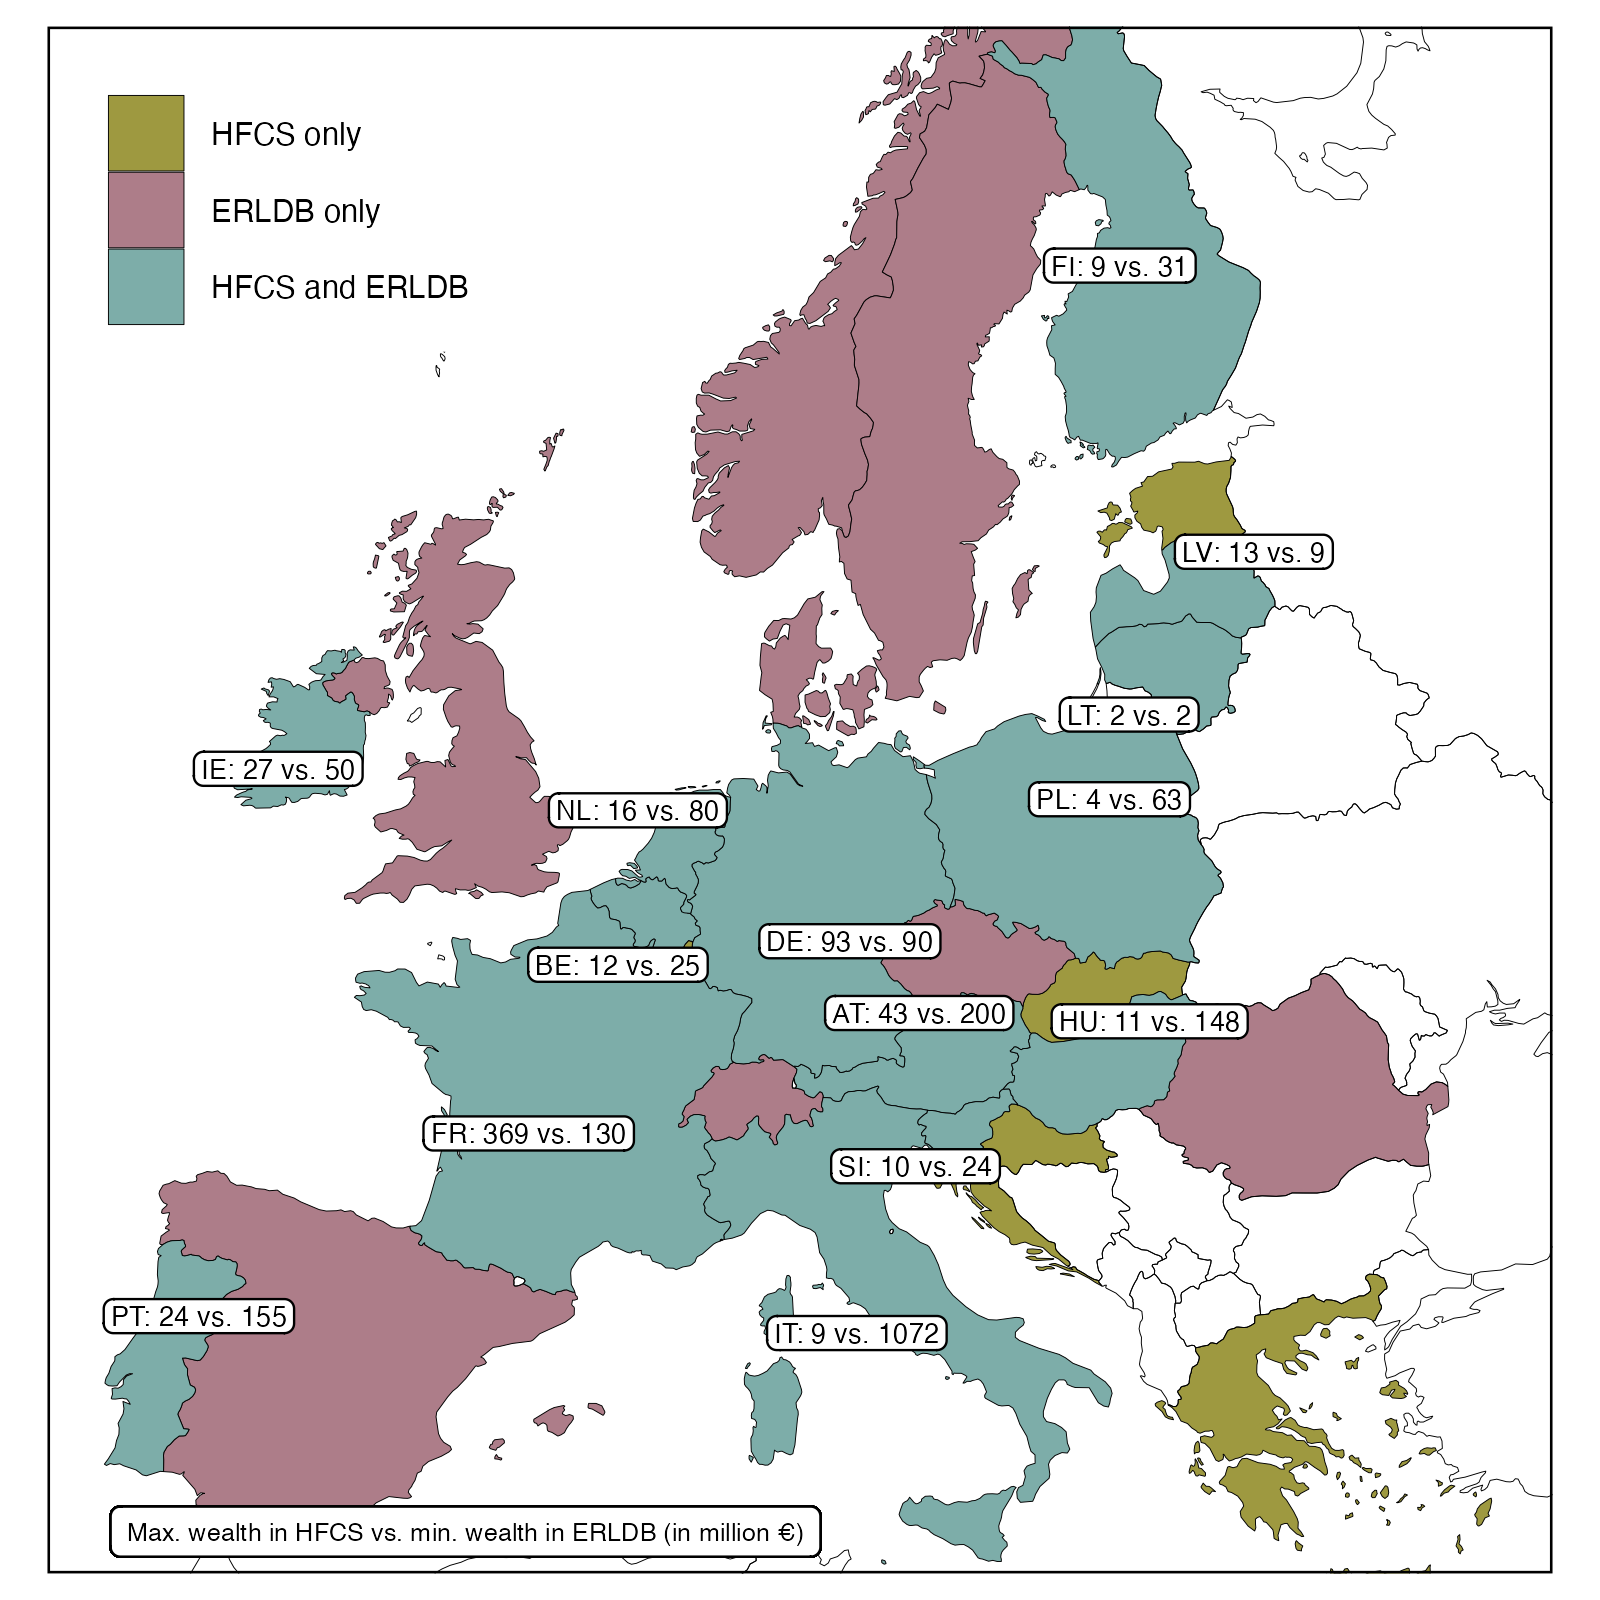 |
Survey data are based on representative samples drawn from total population. However, the probability of drawing one of the few very rich households into the sample is infinitesimal. Moreover, participation in surveys is mostly voluntary and there is a higher refusal rate at the top. This poor coverage of the top in wealth and income surveys conceals the extent of inequality. The figure shows the gap between the richest observation in wealth survey data (HFCS) and the “poorest” observation in national rich lists created by magazines. |
Administrative versus survey data
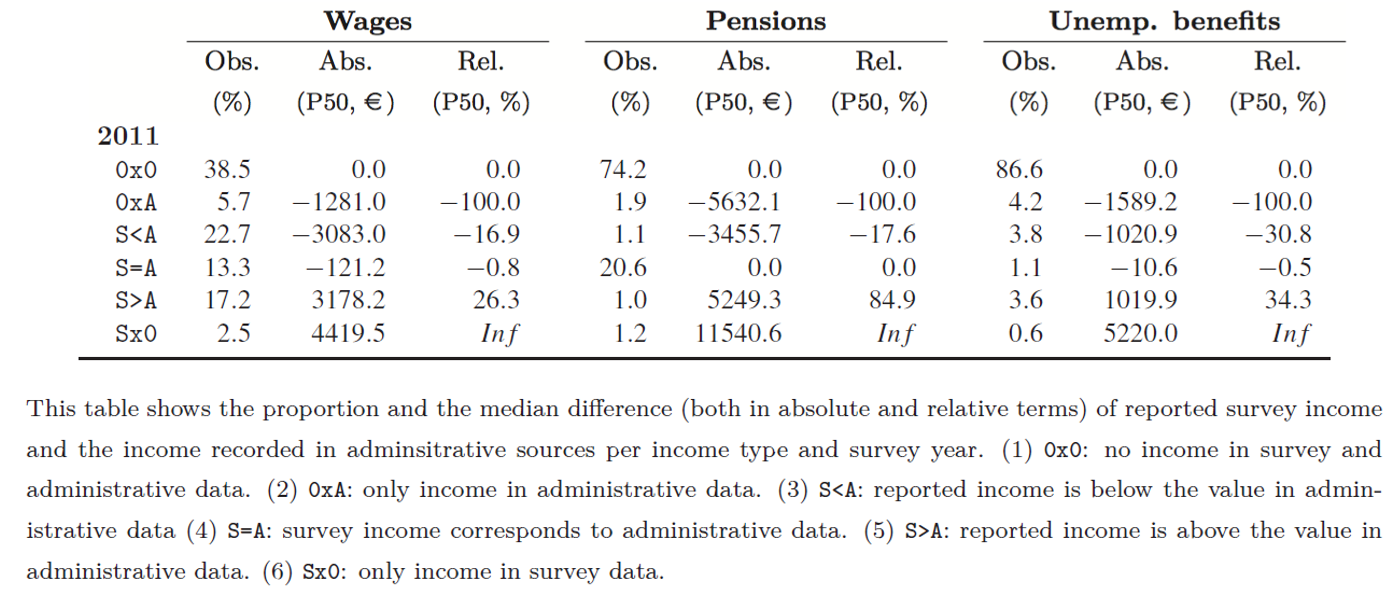
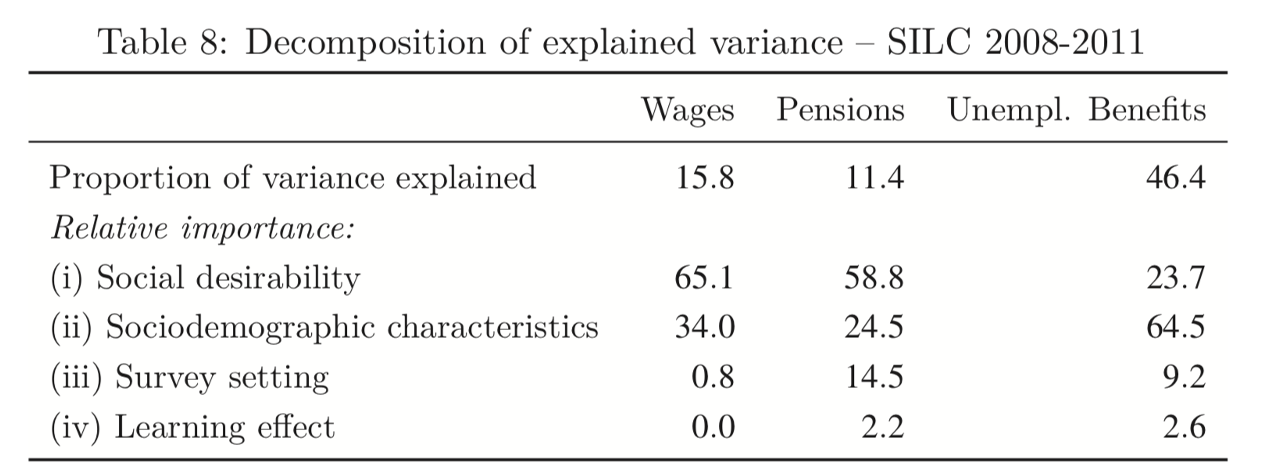
Impact on response behavior:
- Social desirability
- Sociodemographic characteristics
- Survey design
- Learning effect
Mean reverting errors
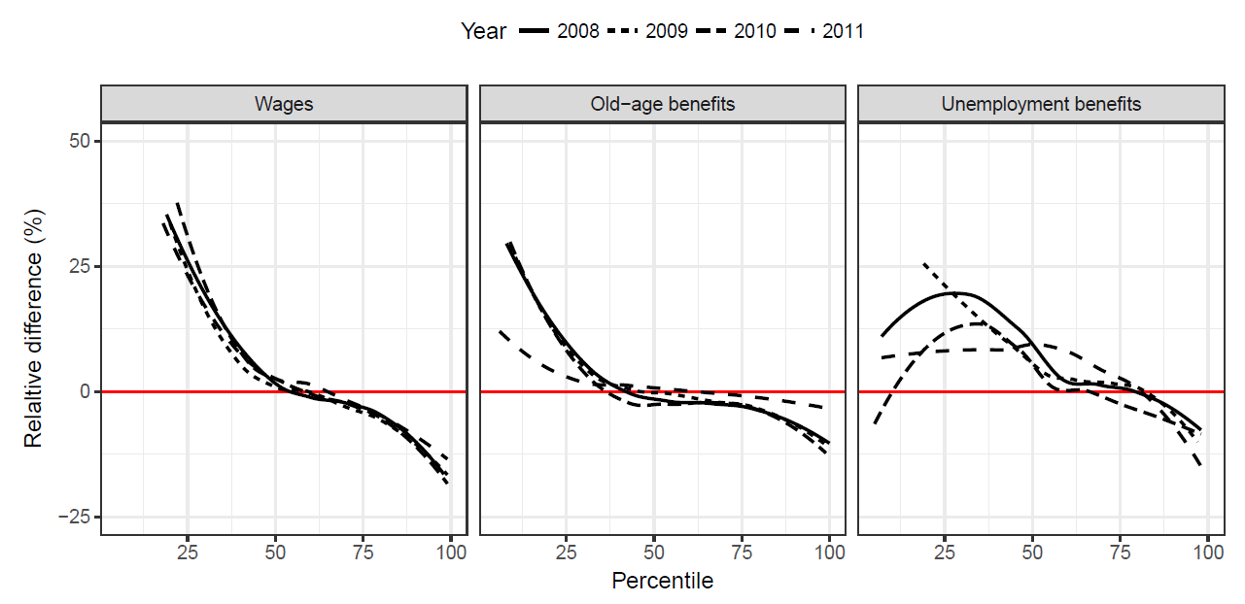
How do we explain the mismatch?
Why should we plot data?

What do we learn when plotting the data?
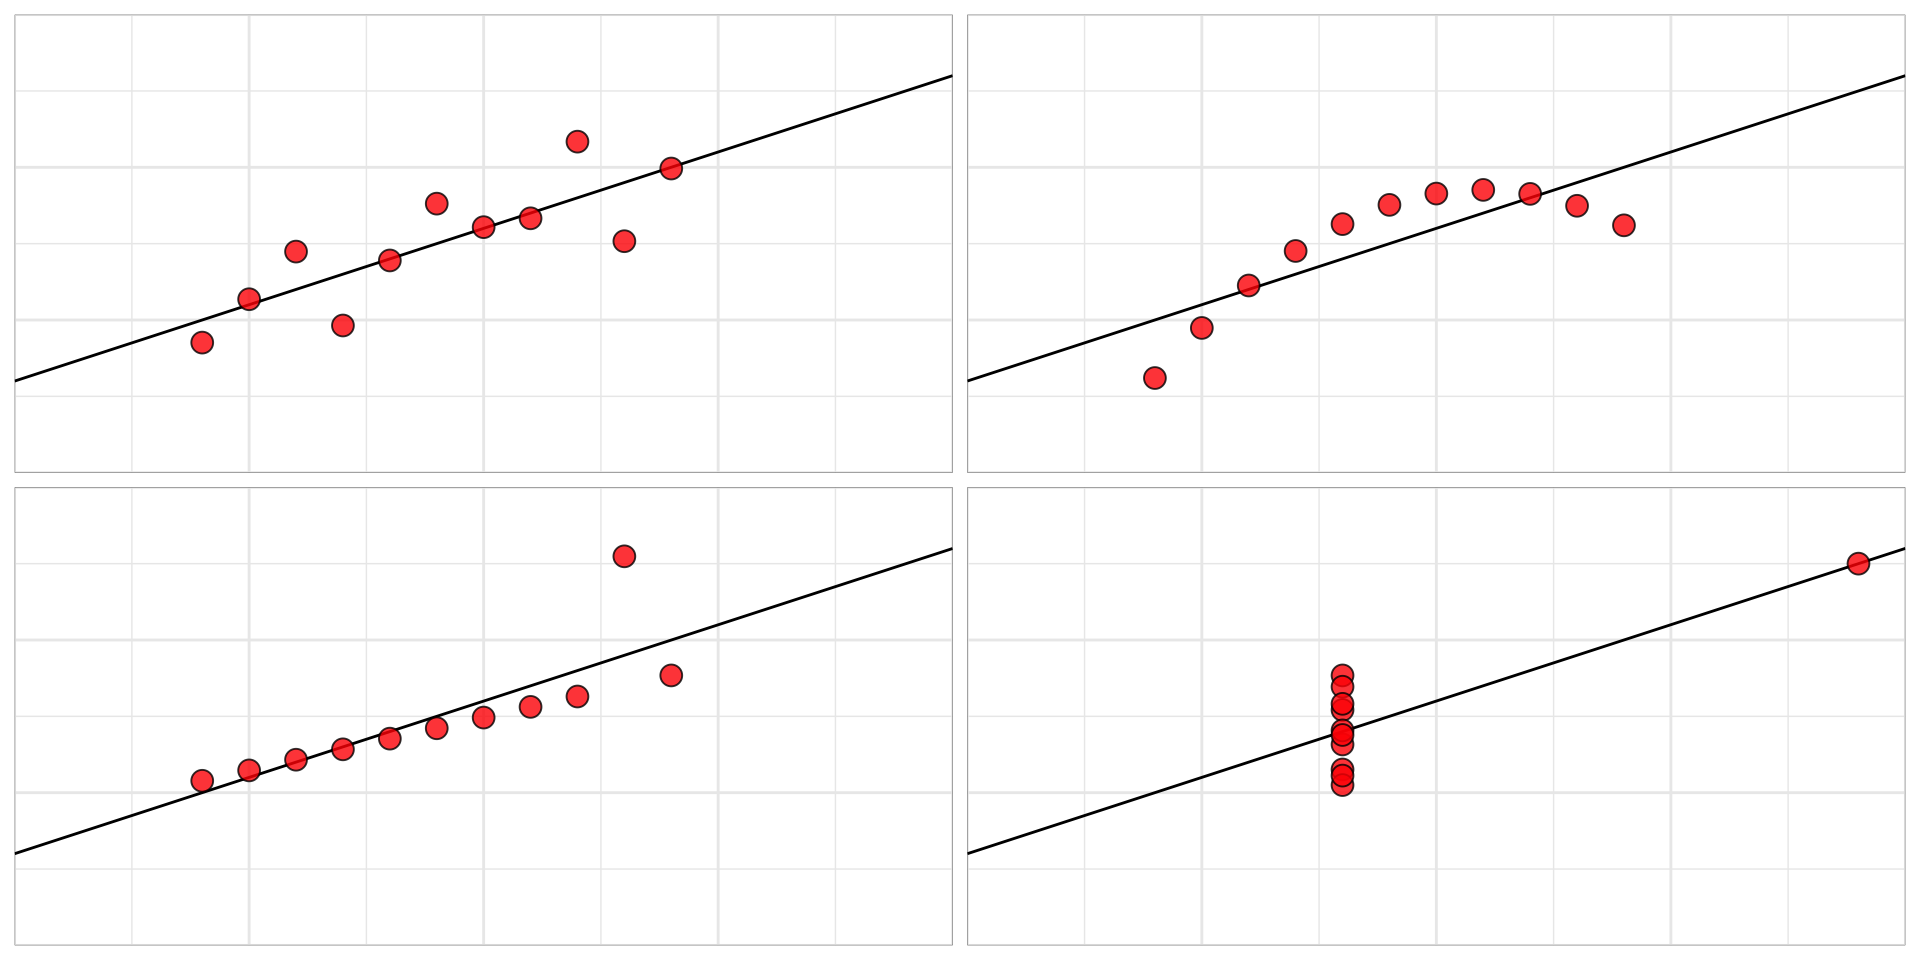
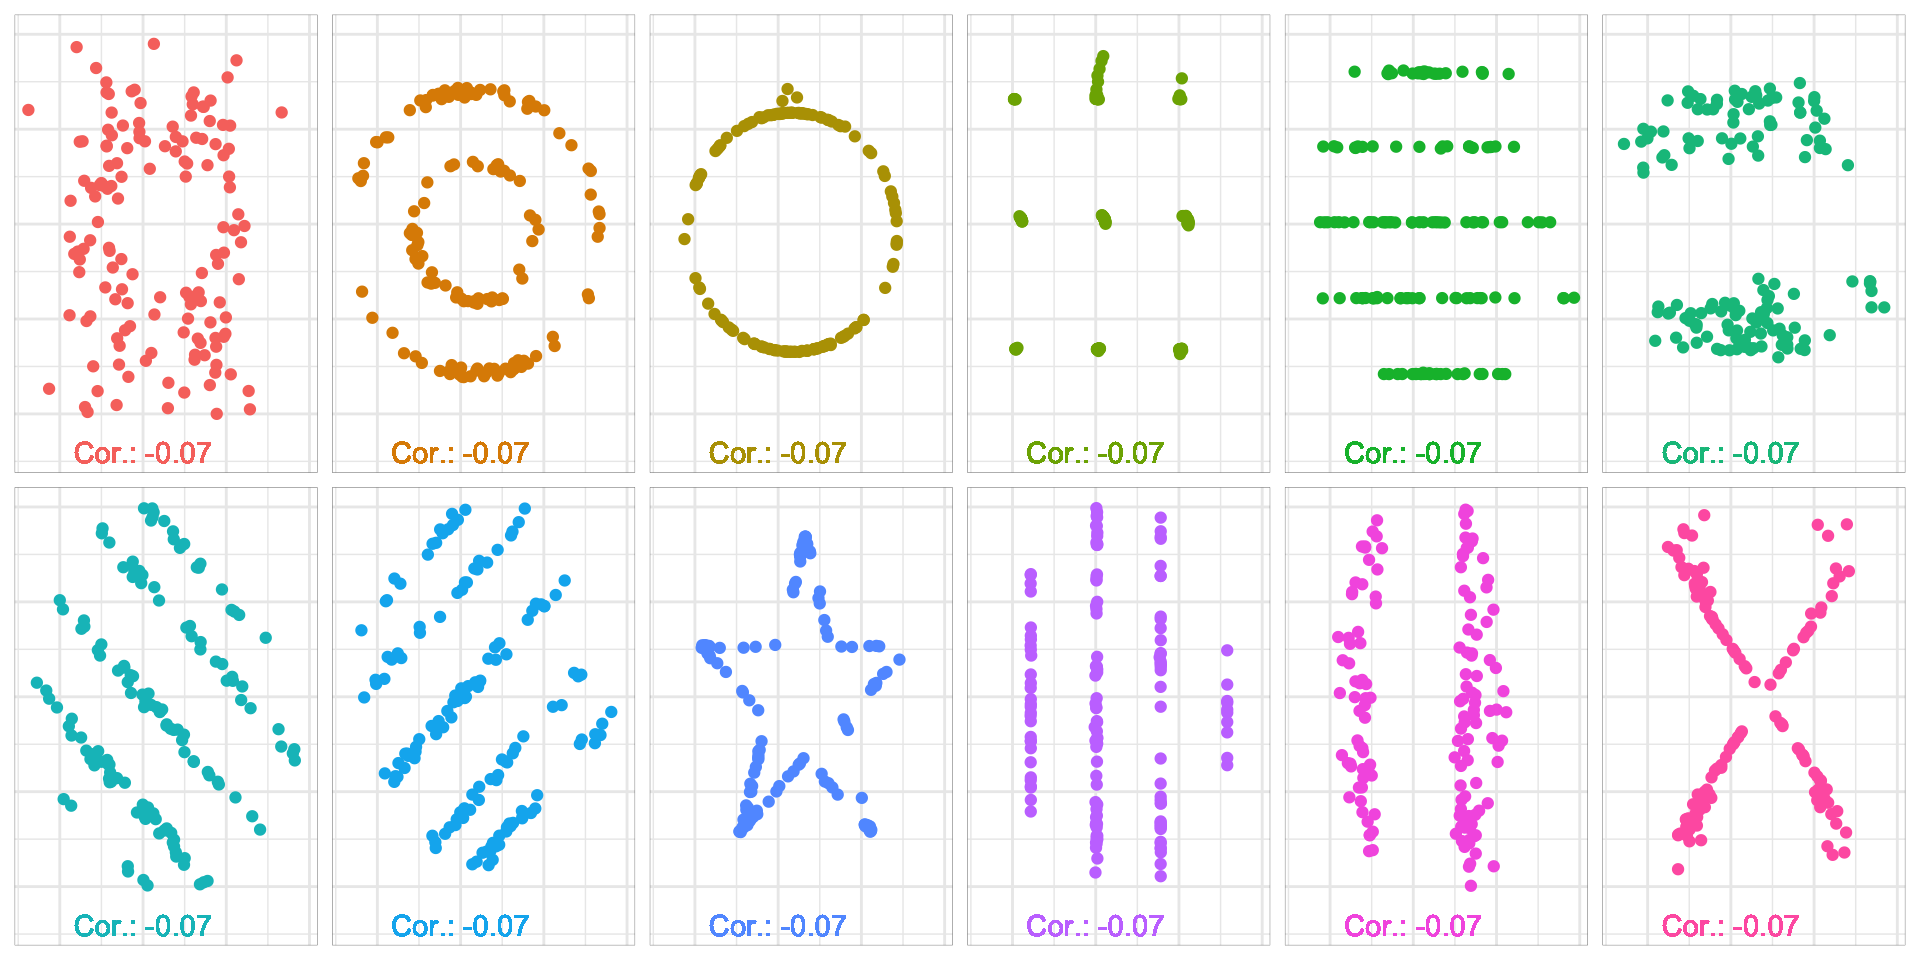
Do you see correlation?
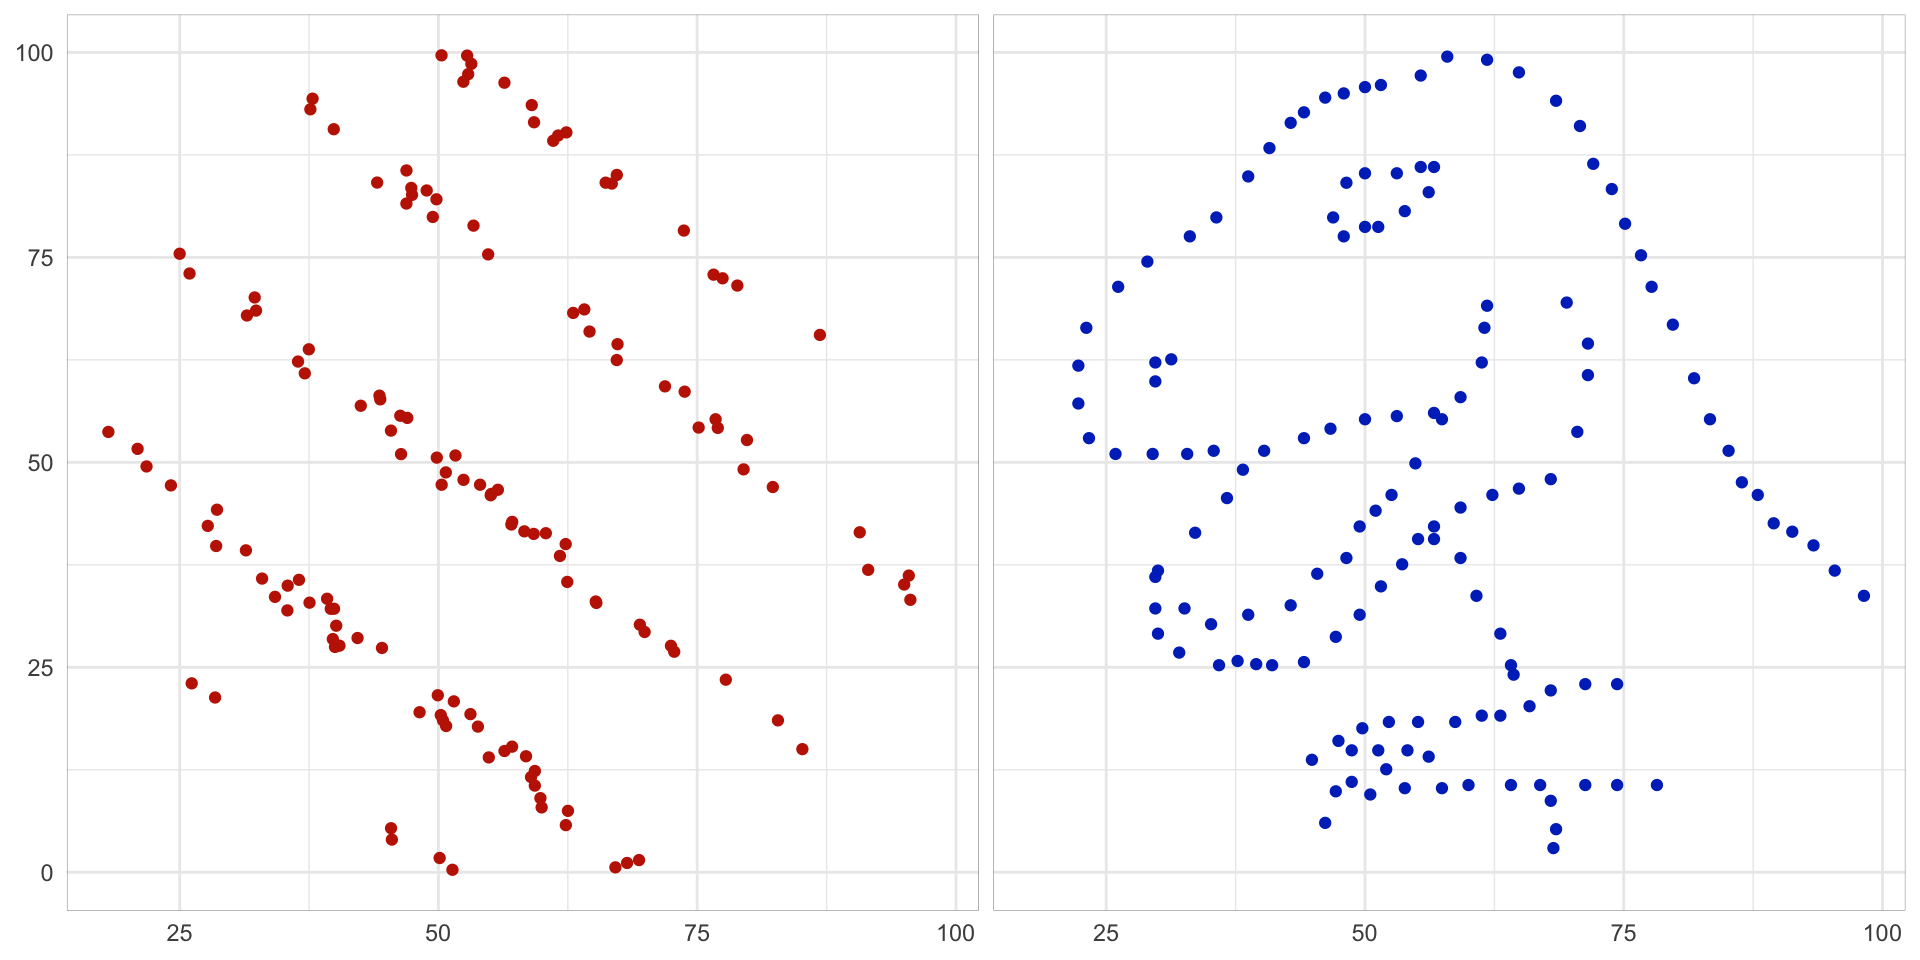
Correlation: -0.07
Correlation: -0.07
Same same but different