library(tidyverse)   # includes lubridate
library(eurostat)    # install.packages("eurostat")

# euro area members (ECB country codes)
ea    <- c("AT","BE","BG","CY","DE","EE","ES","FI","FR","GR","HR",
           "IE","IT","LT","LU","LV","MT","NL","PT","SI","SK")
cc    <- paste(ea, collapse = "+")
start <- "2015-01"

# helper: ECB Data Portal API -> tibble
ecb_get <- function(flow, key, start = "2015-01") {
  url <- paste0("https://data-api.ecb.europa.eu/service/data/", flow, "/", key,
                "?format=csvdata&startPeriod=", start)
  read_csv(url, show_col_types = FALSE) |>
    select(REF_AREA, TIME_PERIOD, OBS_VALUE)
}

# 1. ECB deposit facility rate (daily -> monthly average)
dfr <- ecb_get("FM", "D.U2.EUR.4F.KR.DFR.LEV", start) |>
  mutate(date = floor_date(as.Date(TIME_PERIOD), "month")) |>
  group_by(date) |>
  summarise(dfr = mean(OBS_VALUE, na.rm = TRUE), .groups = "drop")

# 2. HICP inflation, annual rate of change
inflation <- ecb_get("HICP", paste0("M.", cc, ".N.000000.4D0.ANR"), start) |>
  transmute(country = REF_AREA, date = ym(TIME_PERIOD), inflation = OBS_VALUE)

# 3. Cost of borrowing for house purchase, new business
mortgage <- ecb_get("MIR", paste0("M.", cc, ".B.A2C.AM.R.A.2250.EUR.N"), start) |>
  transmute(country = REF_AREA, date = ym(TIME_PERIOD), mortgage_rate = OBS_VALUE)

# 4. Unemployment rate, seasonally adjusted (Eurostat uses EL for Greece)
unemployment <- get_eurostat(
    "une_rt_m",
    filters = list(geo = recode(ea, GR = "EL"), s_adj = "SA",
                   age = "TOTAL", sex = "T", unit = "PC_ACT"),
    time_format = "date") |>
  rename_with(~ "date", any_of(c("time", "TIME_PERIOD"))) |>
  transmute(country = recode(geo, EL = "GR"), date, unemployment = values) |>
  filter(date >= ym(start))

# combine into one panel
panel <- inflation |>
  left_join(mortgage,     by = c("country", "date")) |>
  left_join(unemployment, by = c("country", "date")) |>
  left_join(dfr,          by = "date") |>
  mutate(period = case_when(
    date < as.Date("2022-07-01") ~ "Negative rates",   # first hike July 2022
    date < as.Date("2024-06-01") ~ "Tightening",       # first cut June 2024
    TRUE                         ~ "Easing"
  ) |> factor(levels = c("Negative rates", "Tightening", "Easing"))) |>
  select(date, country, period, dfr, inflation, mortgage_rate, unemployment) |>
  arrange(country, date)

write_csv(panel, "ea_panel.csv")   # saves a copy so you don't re-download each render
Monetary Policy Visualization
Central Banks
Patrick Mokre
November 2, 2026
Central Banks
What do central banks do?
Interest rates
Payments systems
Lending to private banks
Regulation and oversight
Inflation
Growth and employment
Financial markets and institutions
Interest and exchange rates
Independent
Accountable
Transparent
Historical concepts
Central banks go back to the 17th century. Some rulers relied on them for financing, others to regulate the financial system. Until the mid-20th century, most countries did not have a central bank. Almost all had mints that monopolized money production though.
Government bank: Issues currency.
Monetary policy: Influence interest rates.
Bankers’ bank: Holds deposits of private banks.
Bankers’ bank
The central bank hardly interacts with individual customers. It mostly takes deposits, extends credit and auctions off bonds to financial institutions.
Lender of last resort: Lends money to keep credit market going.
Manages payments system: With bank notes ensure that they are circulated, with economic payments ensure they clear.
Oversees commercial banks: Regulate institutions, inspect banks, stress-test system.
What the ECB cannot do
The ECB is tasked with monetary policy, but not fiscal policy.
It cannot determine, and should not influence, budgets or economic policy.
It does not collect taxes or generate income beyond seignorage
Stability
Financial markets tend to:
Episodes of high volatility.
Vicious cycles of increased risk-taking.
Financial instability.
International imbalances.
“The central bank is essentially part of the government.” (Cecchetti and Schönholtz 2021)
Central banks are tasked with stabilizing the system, expressed in interest rates, price levels, exchange rates, even employment and economic growth.
Inflation
Traditionally, price stability has been the primary objective of central banks (e.g. ECB). They are supposed to curb price effects of fiscal expansion, import price, profit or wage pressure.
Interest rates: Central banks make lending more expensive, curbing capital accumulation and wage growth, decreasing demand.
Lending: Credit freezes lead to deflation, central banks step in to re-start the lending cycle.
Central bank independence
No short term policy goals that outweigh long term development.
No electoral pressure to increase fiscal spending with danger of demand outrunning supply.
No democratic oversight or democratic legitimacy.
Recruits from finance or academia with ingrained class interest.
European Central Bank
ESCB ECB + national central banks (NCBs) of all 27 EU states
Eurosystem ECB + 21 euro area NCBs · Frankfurt
Governing Council
Main decision body: sets monetary policy (key interest rates, liquidity, reserves). 6 + 21 members; 21 votes at a time: the Executive Board always votes, NCB governors rotate.
Executive Board
6 members: President Christine Lagarde, Vice-President Boris Vujčić + 4. Appointed by the European Council, 8-year non-renewable terms. Implements policy, runs the ECB day to day.
Supervisory Board
Single Supervisory Mechanism (since 2014). ECB directly supervises the large, systemic banks; NCBs and national authorities handle smaller banks.
▲ governors sit in the Governing Council · ▼ ECB decisions are carried out by the NCBs
21 national central banks
ATBEBGCYDEEEESFIFRGRHRIEITLTLULVMTNLPTSISK
Carry out monetary operations, issue euro banknotes, run payment systems, act as lender of last resort, serve as bankers to banks and governments in their country.
General Council
ECB President + Vice-President + governors of all 27 EU NCBs. Links the euro area to EU states without the euro; prepares euro adoption.
AT Oesterreichische Nationalbank (OeNB) · Vienna
Owner: Republic of Austria
Organized as a stock corporation (AG), 100% state-owned.
General Council (Generalrat)
Supervisory body. President Johannes Hahn, Vice-President Ingrid Reischl + 8 members, appointed by the federal government for 5 years. Oversees and advises the board, nominates board candidates.
▼ oversees
Governing Board (Direktorium)
4 members, appointed by the Federal President on government proposal (6-year terms). Runs the bank.
Governor Martin Kocher
Central bank policy · seat in ECB Governing Council
Central bank policy · seat in ECB Governing Council
Vice-Gov. Edeltraud Stiftinger
Statistics, treasury, accounting
Statistics, treasury, accounting
Josef Meichenitsch
Payments, financial literacy, IT
Payments, financial literacy, IT
Thomas Steiner
Financial stability, banking supervision, holdings
Financial stability, banking supervision, holdings
Subsidiaries print banknotes (OeBS) and mint coins (Münze Österreich). Bank supervision is shared with the Financial Market Authority (FMA).
European Central Bank
The European Central Bank oversees a system of national central banks through anonymous votes of the governing council. Its role and independence is largely codified in the Maastricht accords. Its primary objective is price stability. Secondary objectives include supporting growth and employment as long as it does not run counter to price stability.
Owned by the NCBs.
Carries out monetary policy (relationships with commercial banks) through the NCBs.
Sells and purchases securities but also supplies collateralized lending to banks.
The Austrian National Bank
OeNB was founded in 1923, operating as Austria’s central bank and allocating foreign economic assistance to Austria.
It is an Aktiengesellschaft, with all shares owned by the Republic of Austria since 2010. Before 2010 it was co-owned by the Republic, Wirtschaftskammer and Arbeiterkammer.
The OeNB and Financial Markets Authority (FMA) participate in the European Central Bank as well as the European Systemic Risk Board.
Division of labor
ECB
Target interest rates
Central analysis
Since 2014: single supervisory mechanism for larger banks
NCBs
Operate monetary policy
Issue and administer banknotes
National communication
Supervise smaller banks and non-Eurosystem tasks.
Central banks’ balance sheets
Assets
Securities, mostly treasury issued, since 2007 increasingly risk assets.
Foreign currency reserves to stabilize exchange rates.
Loans to commerical banks.
Liabilities
Currency: all issued bank notes are redeemable.
Government account: The government’s bank account.
Commercial bank deposits and reserves.
Central bank transactions
Open market operations: Buy/sell securities
Foreign exchange intervention: Buy/sell currency reserves.
Extend loans to commercial banks.
Pay out cash to account holders (government or banks).
Unconventional monetary policy
When the global financial crisis of 2007-2009 unfurled, both the Fed and the ECB introduced new central bank instruments dubbed unconventional monetary policy. They are usually legitimized by conventional interest rates approaching the zero lower bound.
This included targeted asset purchases (e.g. of mortgage backed securities) rather than broad interventions; targeted long-term refinancing operations as cheap credit to warm up credit freezes; and most famously, quantitative easing
Quantitative easing
Quantitative easing supplies reserves to commercial banks beyond the assumed supply/demand relationship that sets the target rate.
The goal of quantitative easing is to supply firms and consumers with money through bank operations.
Quantitative easing
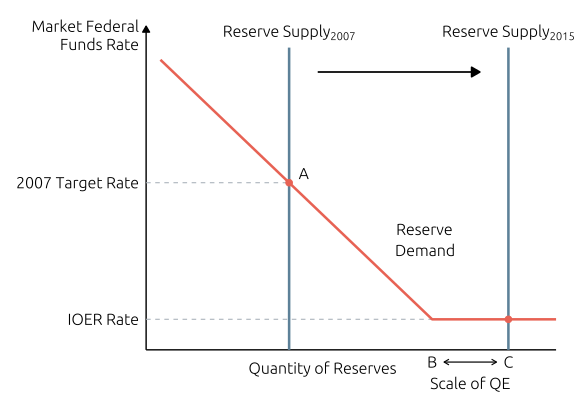
Figure 1: Schematic illustration of post-2007 quantitative easing in the United States
Geometries
Grammar of graphics
In this course, we mainly work with the ggplot2 R package. The gg stands for Wilkinson’s grammar of graphic. For now it will suffice to understand the basic categories of this grammar.
Variables secribe the underlying data structure.
Algebra are operations that combine variables.
Geometry create graphical shapes from variables.
Aesthetics assign data to dimensions of the data - e.g. x- and y-axis, color, or size.
Statistics are functions that change the appearance of geometries.
Scales represent variables in different dimensions (e.g. the stretching of axis or color palettes).
Coordinates are a mapping of graphs onto the 2 dimensional representation we perceive as plots.
Geometries
Geometries (in ggplot2: geoms) are an intuitive concept: The shapes we choose to visualize.
geom_bar
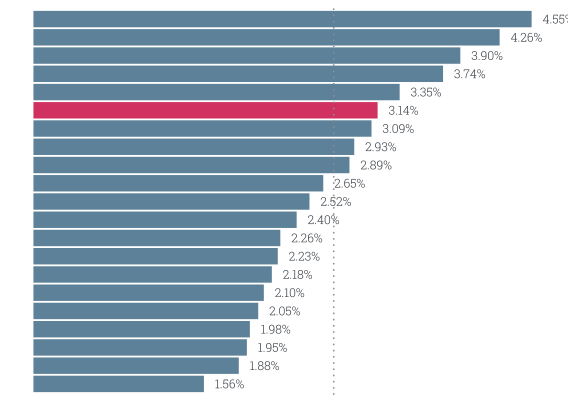
Bar Charts for comparing mean inflation rates between countries.
geom_bar
panel |>
  group_by(country) |>
  summarize(inflation=mean(inflation, na.rm=TRUE)) |>
  mutate(country=fct_reorder(country, inflation)) |>
  ggplot() +
  geom_col(aes(y=country, x=inflation,
               fill=(country=="AT"))) +
  geom_text(aes(y=country,
                x=inflation + .1,
                label=sprintf("%.2f%%", inflation)),
            family="robotoslab",
            hjust = 0,
            color=pal[["grey800"]],
            size=3.2) +
  geom_vline(xintercept=mean(panel$inflation, na.rm=TRUE),
             linetype=3,
             color=pal[["grey600"]]) +
  scale_fill_manual(values=c("FALSE"=pal[["blue"]], "TRUE"=pal[["dred"]]),
                    guide="none") +
  theme_econpol(text_x=FALSE, text_y=FALSE, title_x=FALSE, title_y=FALSE)
geom_line
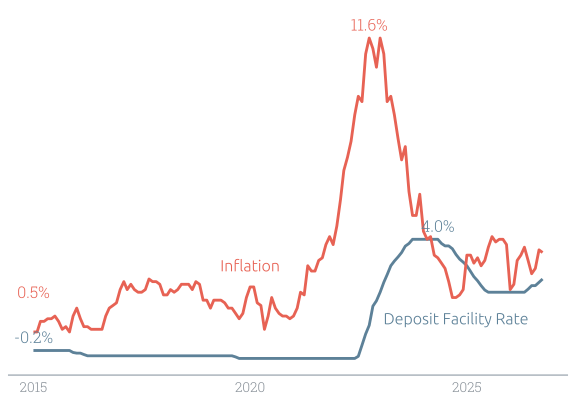
Line Plot to illustrate the development of inflation and the deposit facility rate in Austria.
geom_line
panel |>
  filter(country=="AT") |>
  ggplot() +
  geom_line(aes(x=date, y=dfr), color=pal[["blue"]], linewidth = 1) +
  geom_line(aes(x=date, y=inflation), color=pal[["red"]], linewidth = 1) +
  annotate("text",
           x=as.Date("2020-01-01"),
           y=3,
           label="Inflation",
           color=pal[["red"]],
           family="ubuntu") +
  annotate("text",
           x=as.Date("2024-10-01"),
           y=1,
           label="Deposit Facility Rate",
           color=pal[["blue"]],
           family="ubuntu") +
  annotate("text",
           y=(panel |>
                filter(country=="AT") |>
                filter(inflation==max(inflation)) |>
                pull(inflation) |>
                max())
           + .5,
           x=(panel |>
                filter(country=="AT") |>
                filter(inflation==max(inflation)) |>
                pull(date) |>
                min()),
           label=sprintf("%.1f%%", panel |>
                           filter(country=="AT") |>
                           filter(inflation==max(inflation)) |>
                           pull(inflation) |>
                           max()),
           color=pal[["red"]],
           family="robotoslab"
  ) +
    annotate("text",
           y=(panel |>
                filter(country=="AT") |>
                filter(date==min(date)) |>
                pull(inflation) |>
                max())
           + 1.5,
           x=(panel |>
                filter(country=="AT") |>
                filter(date==min(date)) |>
                pull(date) |>
                min()),
           label=sprintf("%.1f%%", panel |>
                           filter(country=="AT") |>
                           filter(date==min(date)) |>
                           pull(inflation) |>
                           max()),
           color=pal[["red"]],
           family="robotoslab"
  ) +
  annotate("text",
           y=(panel |>
                filter(country=="AT") |>
                filter(dfr==max(dfr)) |>
                pull(dfr) |>
                max()) + .5,
           x=(panel |>
                filter(country=="AT") |>
                filter(dfr==max(dfr)) |>
                pull(date) |>
                max()),
           label=sprintf("%.1f%%",
                         panel |>
                           filter(country=="AT") |>
                           filter(dfr==max(dfr)) |>
                           pull(dfr) |>
                           max()),
           color=pal[["blue"]],
           family="robotoslab"
  ) +
    annotate("text",
           y=(panel |>
                filter(country=="AT") |>
                filter(date==min(date)) |>
                pull(dfr) |>
                max()) + .5,
           x=(panel |>
                filter(country=="AT") |>
                filter(date==min(date)) |>
                pull(date) |>
                max()),
           label=sprintf("%.1f%%",
                         panel |>
                           filter(country=="AT") |>
                           filter(date==min(date)) |>
                           pull(dfr) |>
                           max()),
           color=pal[["blue"]],
           family="robotoslab"
  ) +
  theme_econpol(text_y=FALSE, title_x=FALSE, title_y=FALSE) +
  theme(axis.line.x=element_line(color=pal[["grey500"]]))
geom_point
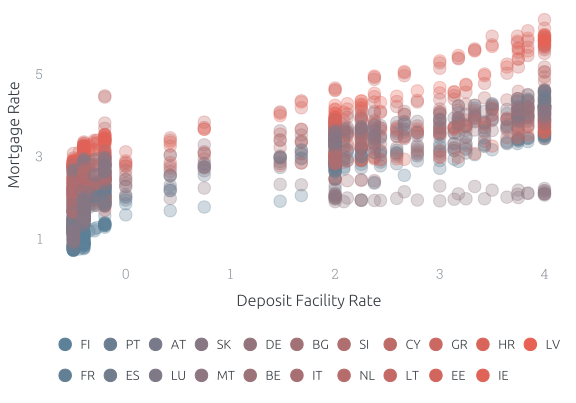
Scatter Plot to illustrate the relationship of deposit facility rates and mortgage rates.
geom_point
panel |>
  mutate(country=fct_reorder(country, mortgage_rate, .fun=mean, na.rm=TRUE)) |>
  ggplot() +
  geom_point(aes(x=dfr, y=mortgage_rate, color=country),
             alpha=0.3,
             size=4) +
  scale_color_manual(values=pal_ramp(n_distinct(panel$country))) +
  guides(color = guide_legend(nrow = 2,
         override.aes = list(alpha = 1)
          )
         ) +
  labs(x="Deposit Facility Rate", y="Mortgage Rate") +
  scale_y_continuous(breaks=c(1,3,5)) +
  theme_econpol()
geom_density
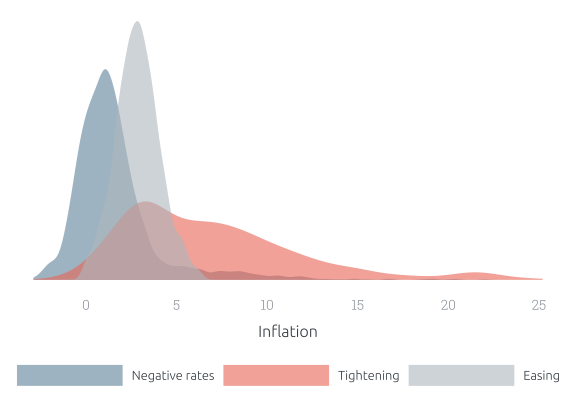
Density Plot to illustrate the differences of country inflation rates under the same regime.
geom_density

PI 0588 Economic Policy (Applied track) | Winter term 2026