Chart & Report
Data visualization
The Austrian Patent Office will exclusively provide internal data to create data visualizations and illustrate the process of private innovation in Austria. You will be able to select a topic and obtain a ready-made dataset from the agency. You have to create a preliminary chart for a presentation in one of the two final sessions. The presentation should contain the research question, an intuition of the underlying data and, most important, your considerations behind the style of the chart. Your time slot for the presentation is five minutes. Afterwards we will have a brief Q&A in class together with an evaluation of the lecturer and representatives of the Patent Office. The presentation should only have a small number of slides with little text to lead the audience through the process of chart creation, e.g.
- Research question: What do you want to answer with your chart?
- Data: What data did you use?
- Chart: What does the chart show? What were your thoughts when choosing this style?
Please also carefully read the accompanying information document provided by the Austrian Patent Office:
RMarkdown report
Students are required to draft a short report around the chart, containing the most important information of chart creation and the entire R code. The final version of the report is due on January 31, 2024. You should work with RMarkdown which is a handy and simple tool to compose reports based on R code. It is recommended to edit the document in RStudio. The final report will be an HTML file and should be structured as follows:
- Research question: What is the specific research question that you want to address with your visualization?
- Data: What data was available and what did you actually use? If helpful, you might want to include some descriptive statistics as a table.
- Result: Present and describe the chart that you have created.
- Conclusion: What are the main conclusions from your chart?
- Code: Provide the full code for your data visualization as a code block in the appendix of the report.
The charts and the report will be published under the CC BY-NC 4.0 license. The Austrian Patent Office will be authorized to (re-)use and edit visualizations and code for non-commercial purposes.
Topics
Visualization Awards
The Austrian Patent Office will award the best three data visualizations. The winning project receives €300, the second place €150, and the third place €50. Selected figures might also be published in the annual report of the Patent Office and thus made available to a broader audience.
Cheatsheets
Additional online resources
 |
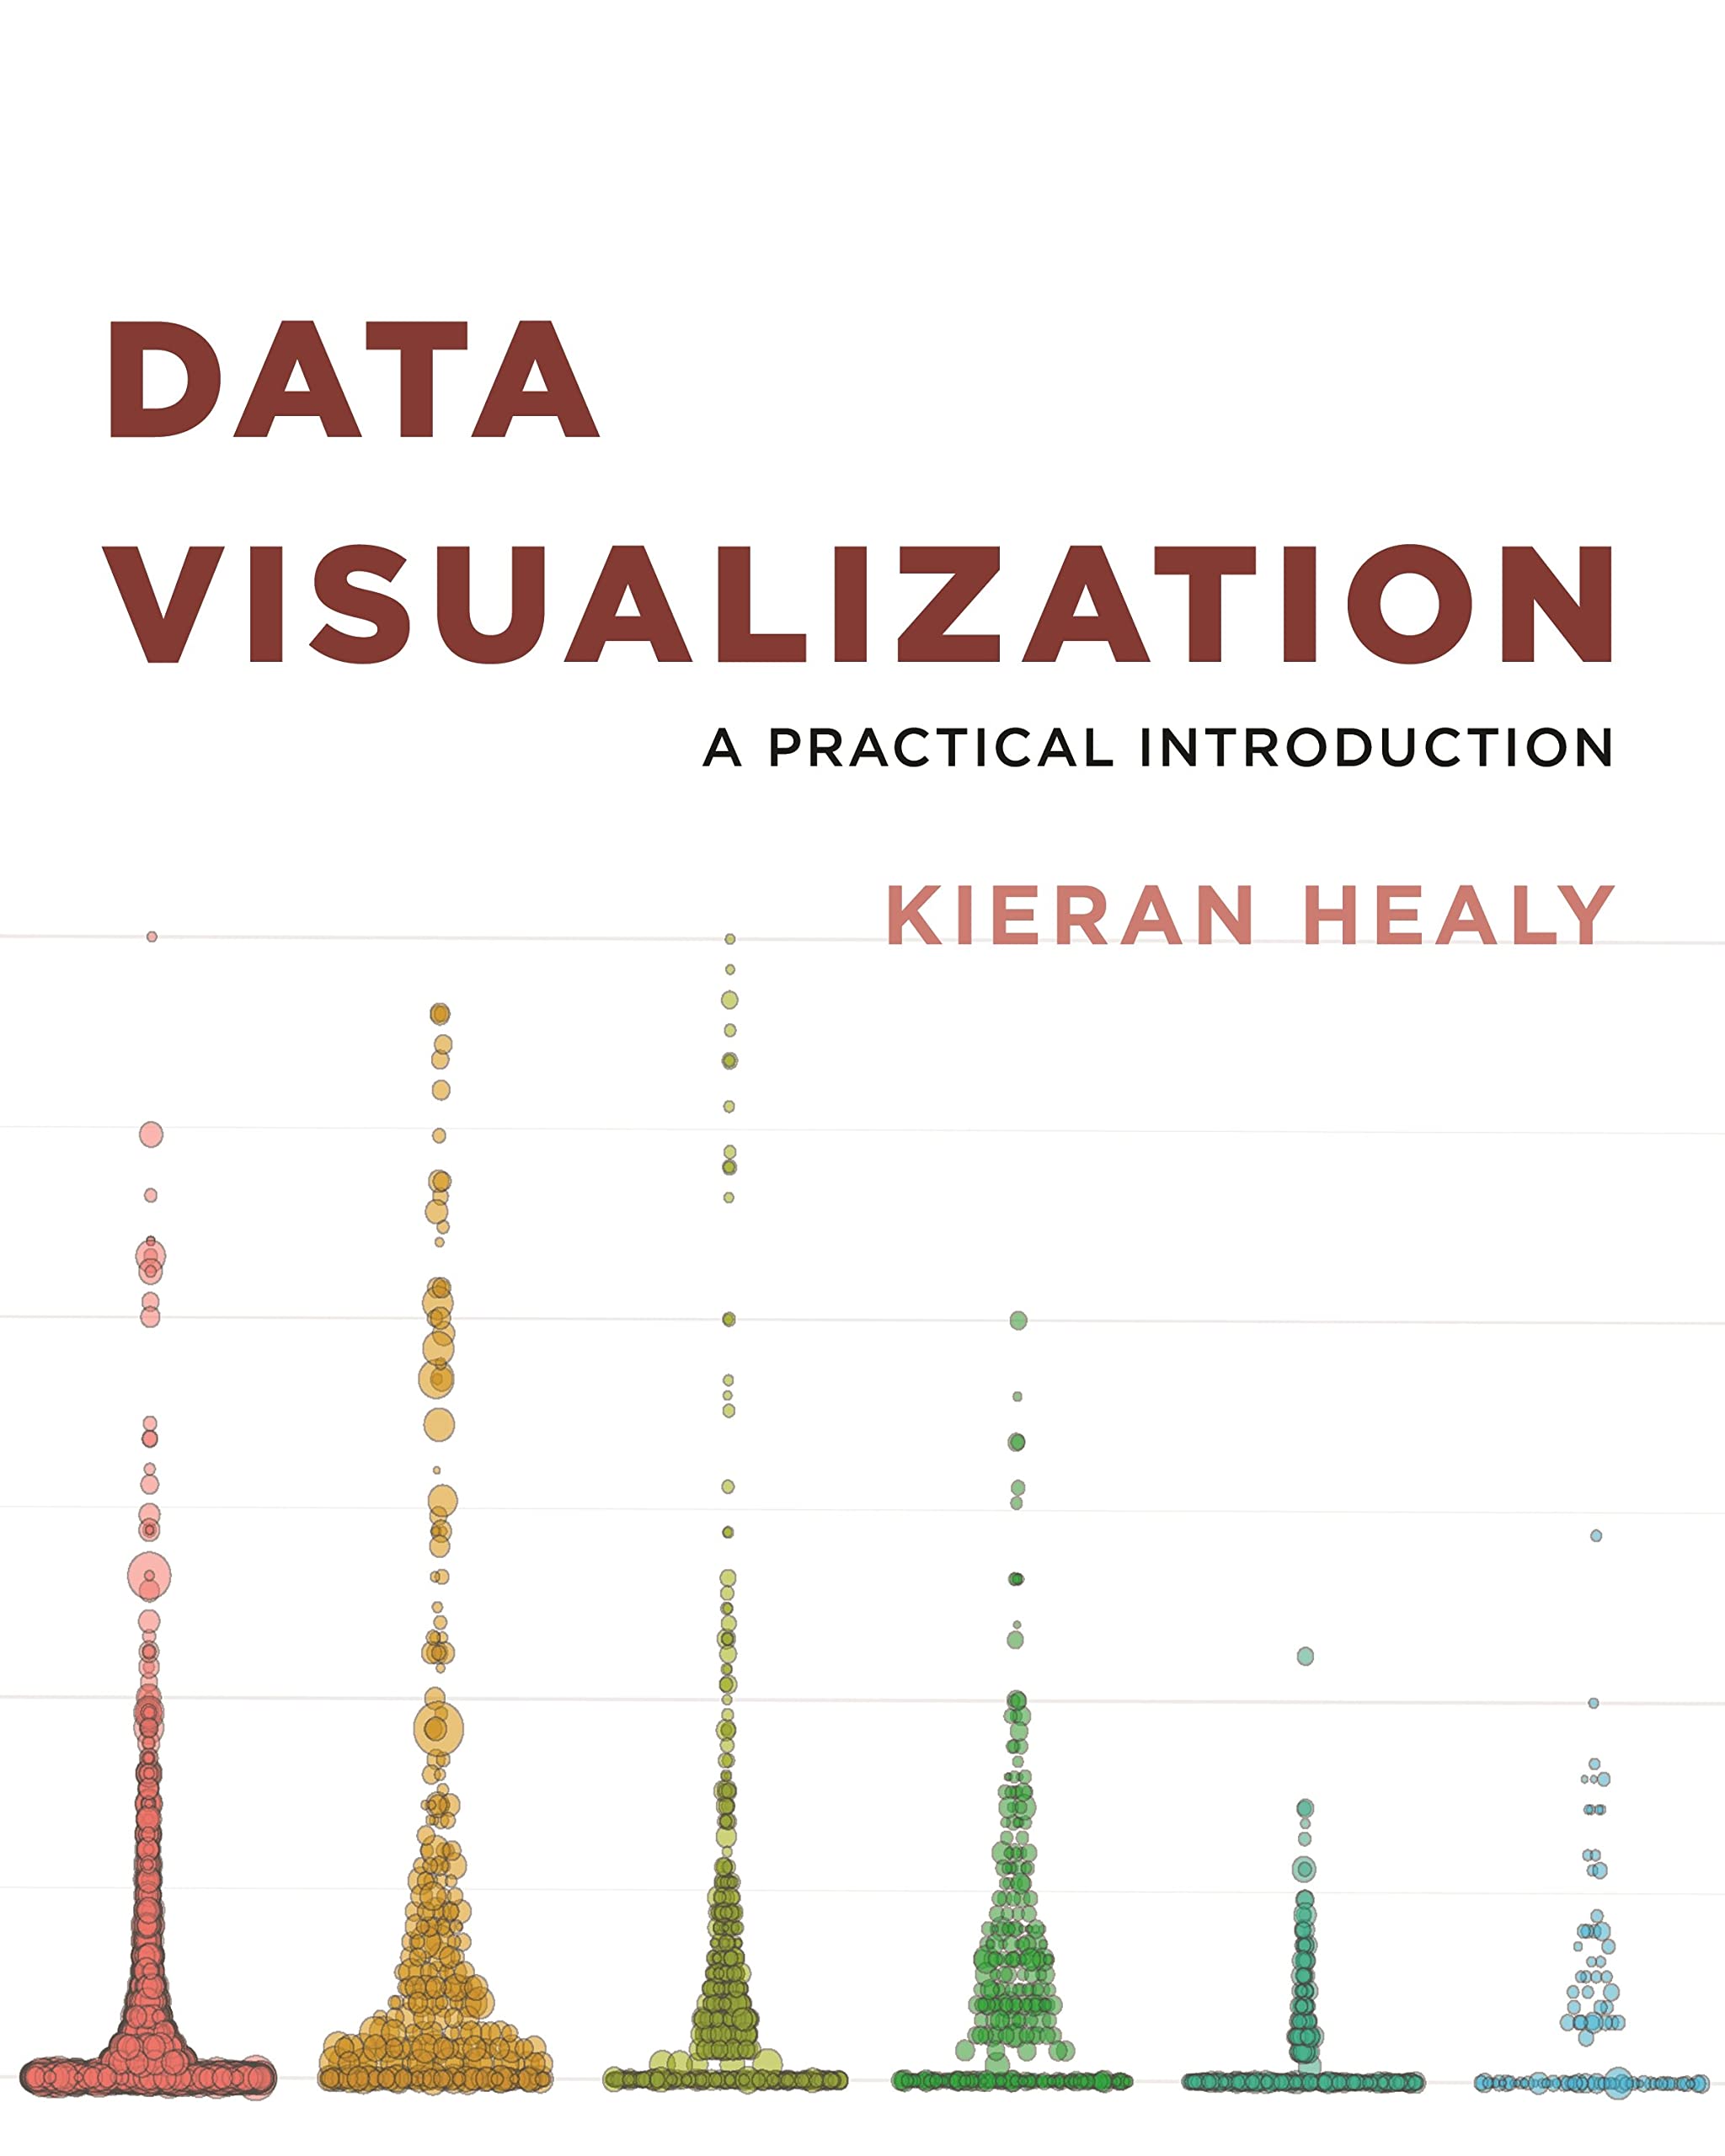
Kieran Healy Data Visualization: A Practical Introduction Princeton University Press ISBN-13: 9780691181622 Link |
 |
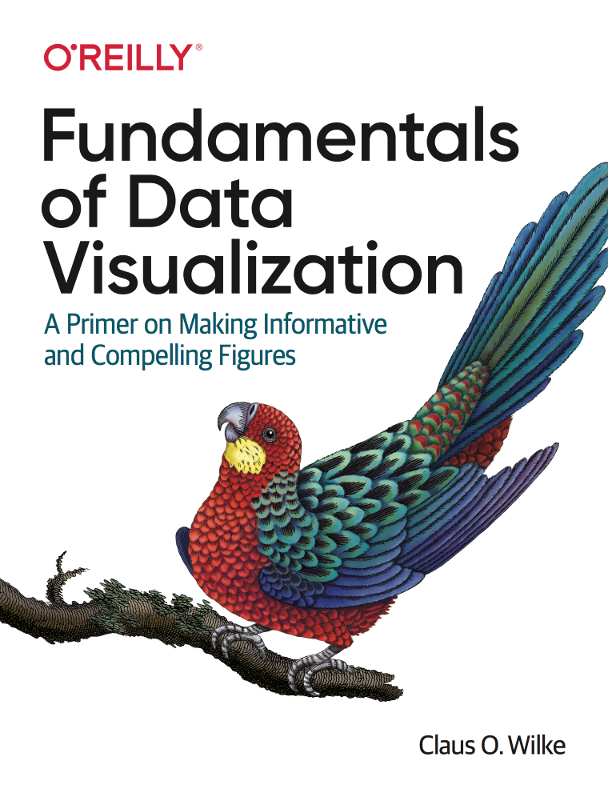
Claus O. Wilke Fundamentals of Data Visualization: A Primer on Making Informative and Compelling Figures O’Reilly Media ISBN-13: 9781492031086 Link |
 |
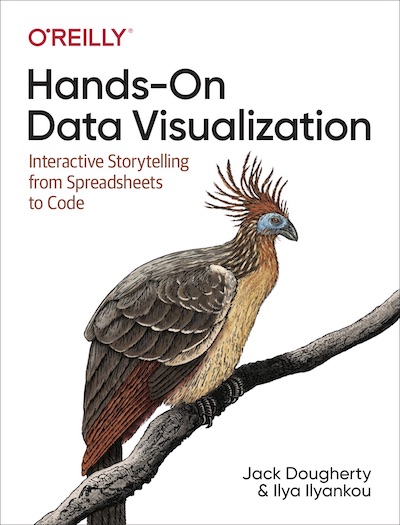
Jack Dougherty and Ilya Ilyankou Hands-On Data Visualization: Interactive Storytelling from Spreadsheets to Code O’Reilly Media ISBN-13: 9781492086000 Link |


