Chart & Report
Data visualization
You will create a preliminary chart for a presentation in one of the two final sessions of the course. The presentation should provide an intuition of the research question you want to address, the underlying data of the chart and, most important, your considerations behind the style of the chart. Your time slot for the presentation is five minutes. Afterwards we will have a brief Q&A in class. The presentation should only have a small number of slides with little text to lead the audience through the process of chart creation, e.g.
- Research question: What do you want to answer with your chart?
- Data: What data did you use?
- Chart: What does the chart show? What were your thoughts when choosing this style?
- Conclusion: What can we learn from the data visualization for economic policy?
RMarkdown report
Students are required to draft a short report around the chart, containing the most important information of chart creation and some economic policy background. The final version of the report is due on June 30, 2023. You should work with RMarkdown (or Quarto) which is a handy and simple tool to compose reports based on R code. It is recommended to edit the document in RStudio and compile it as HTML file. The final report should be structured as follows:
- Introduction: Explain why the topic you chose is important and interesting for the academic/public debate.
- Research question: What is the specific research question that you want to address with your visualization?
- Data: What data did you use? What are the limitations of the data? If helpful, you might want to include some descriptive statistics as a table.
- Result: Present and describe the chart that you have created.
- Conclusion: What are the policy conclusions of your chart?
- Code: Provide the full code for your data visualization as a code block in the appendix of the report.
Cheatsheets
Additional online resources
 |
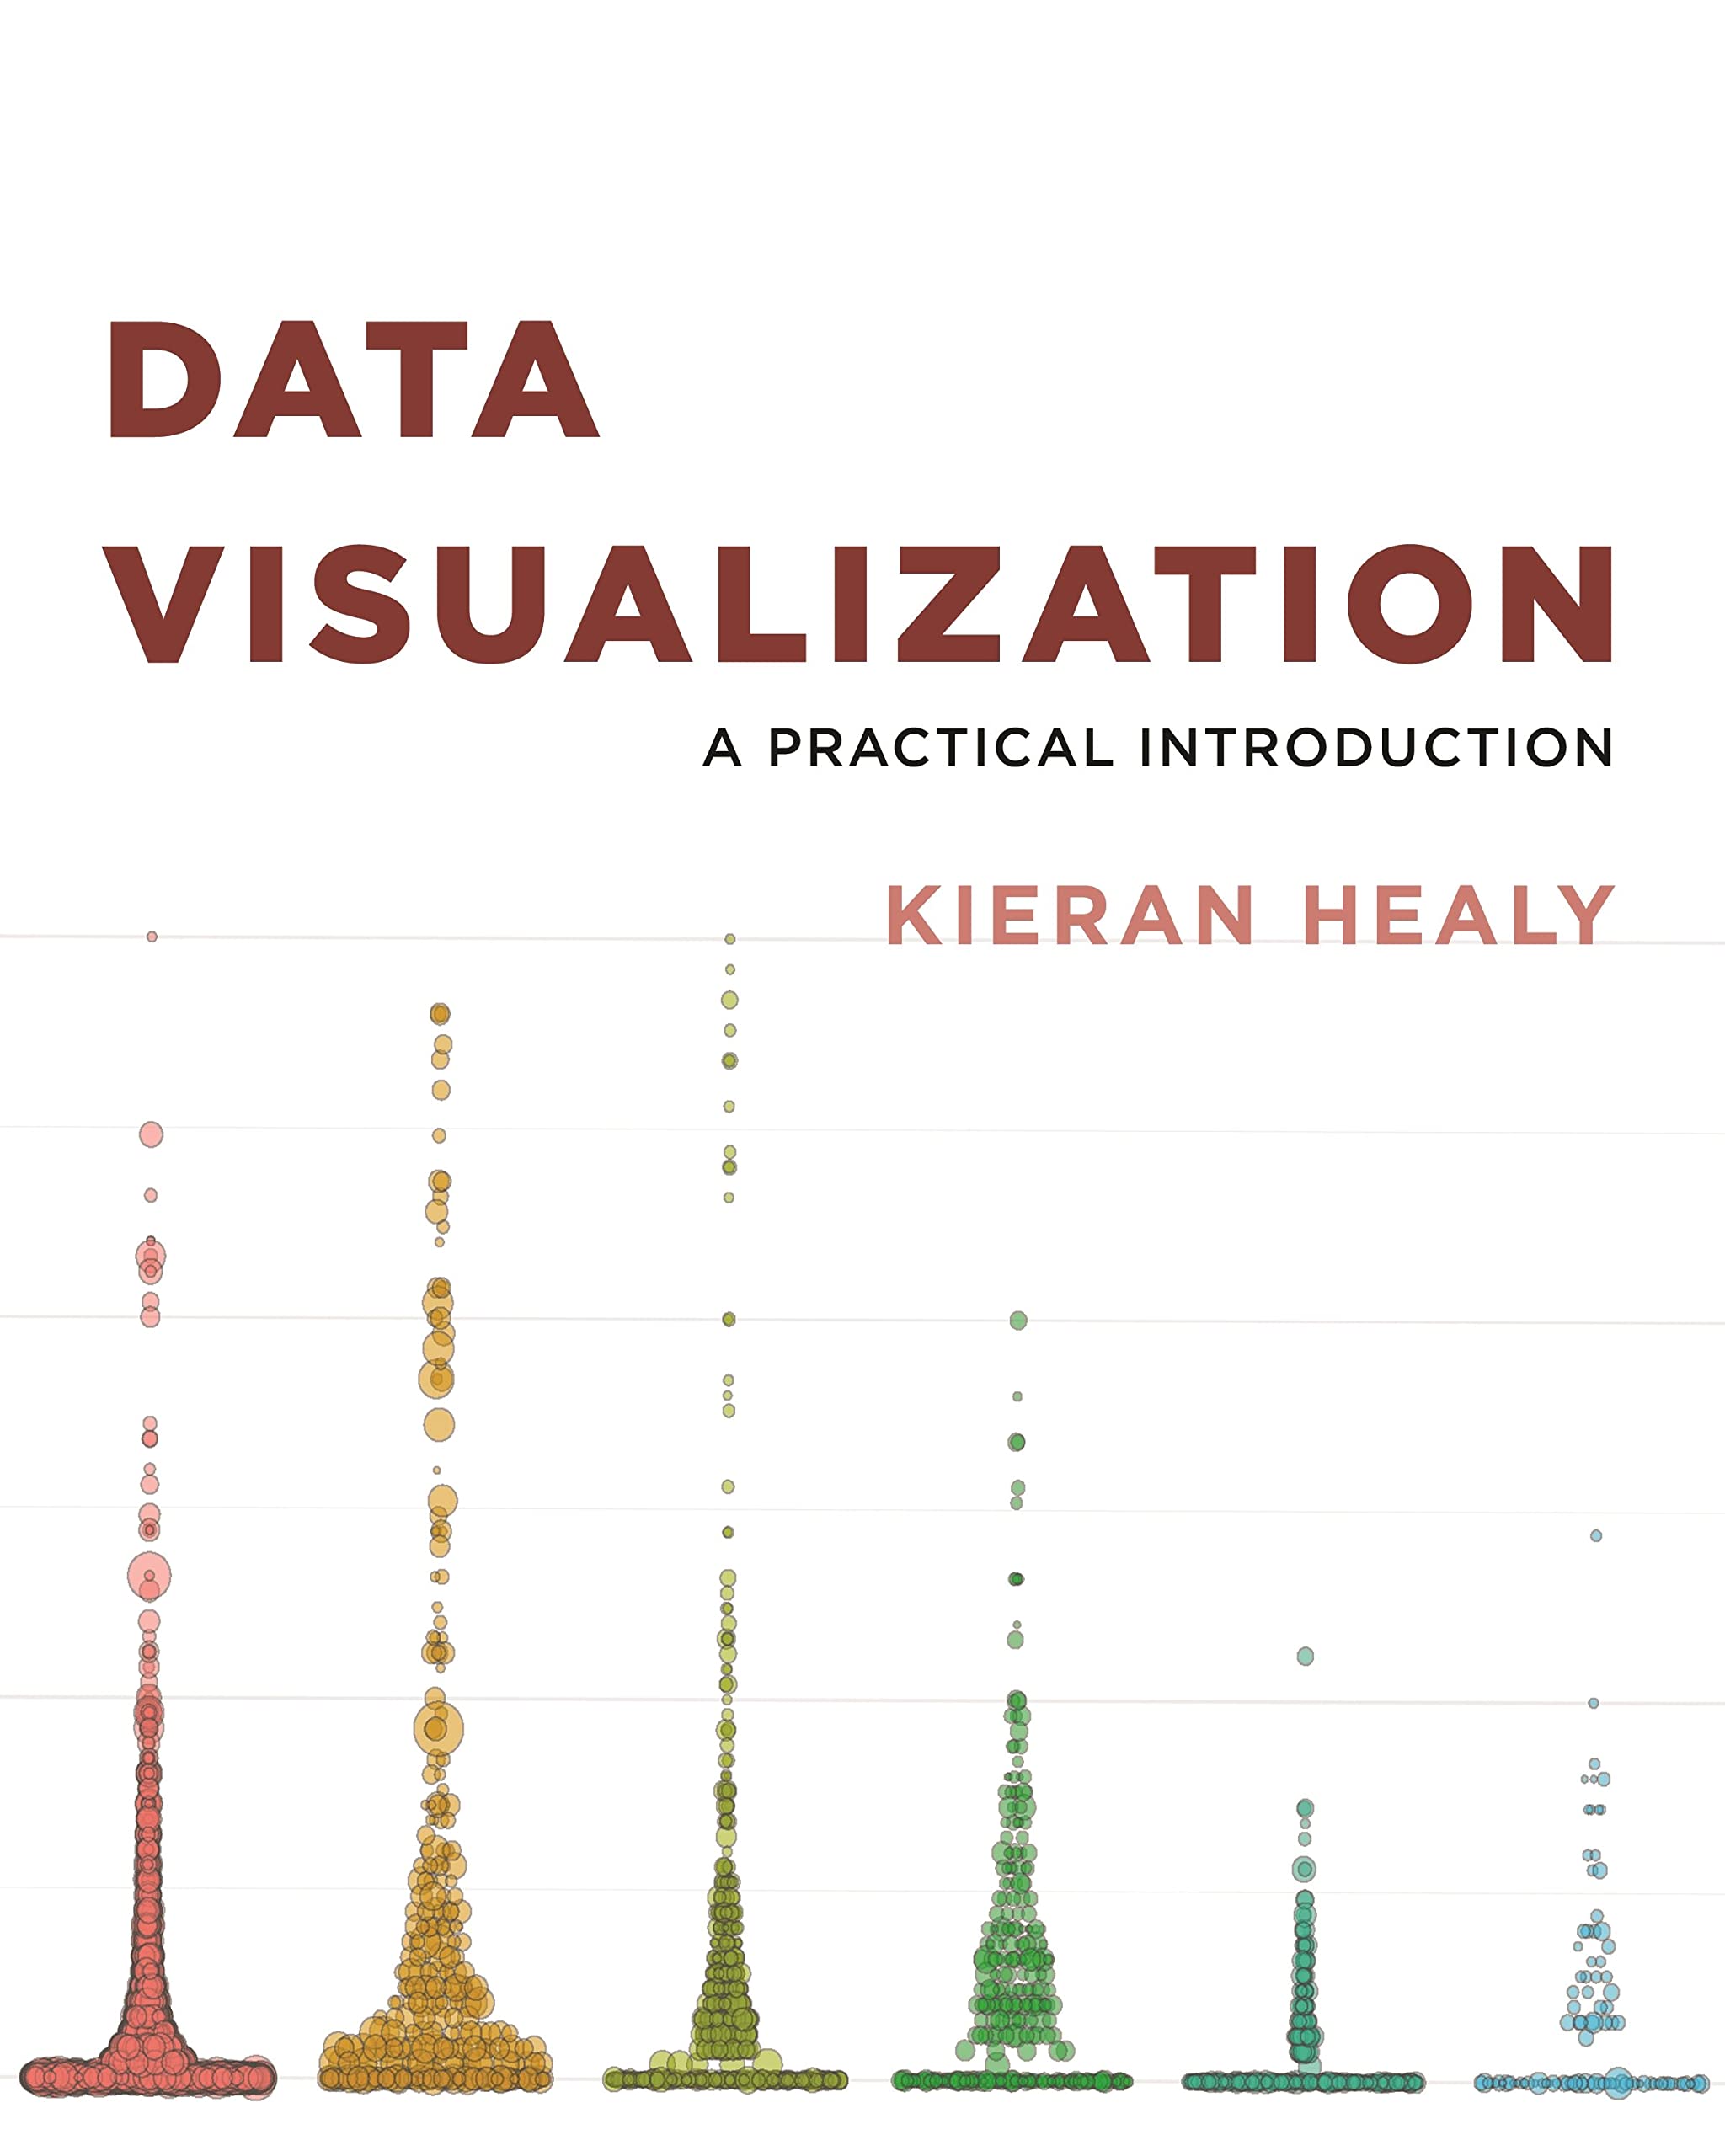
Kieran Healy Data Visualization: A Practical Introduction Princeton University Press ISBN-13: 9780691181622 Link |
 |
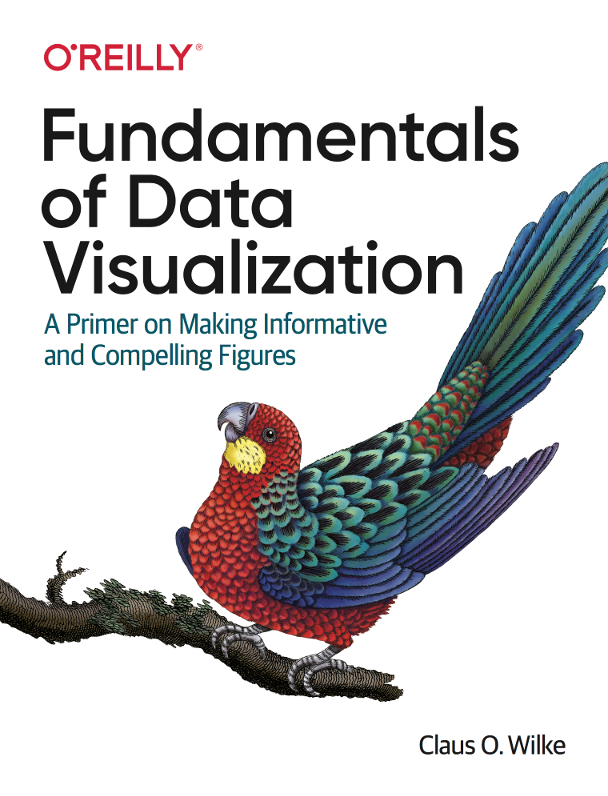
Claus O. Wilke Fundamentals of Data Visualization: A Primer on Making Informative and Compelling Figures O’Reilly Media ISBN-13: 9781492031086 Link |
 |
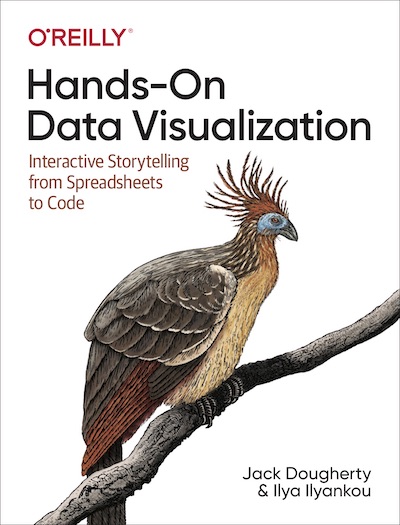
Jack Dougherty and Ilya Ilyankou Hands-On Data Visualization: Interactive Storytelling from Spreadsheets to Code O’Reilly Media ISBN-13: 9781492086000 Link |


