Hello, my name
is Matthias
I'm an economist at the Austrian Federal Chamber of Labour researching on social inequalities. Check out my personal webpage to learn more about my research. I like processing data and visualizing information in R.
About this site
I mainly share data visualizations on my twitter profile. On this site, I present a selection of my work. I am not a trained graphic designer, but rather an ambitious autodidact with a passion for data and aesthetics. I hope you enjoy my portfolio.

Searching for data
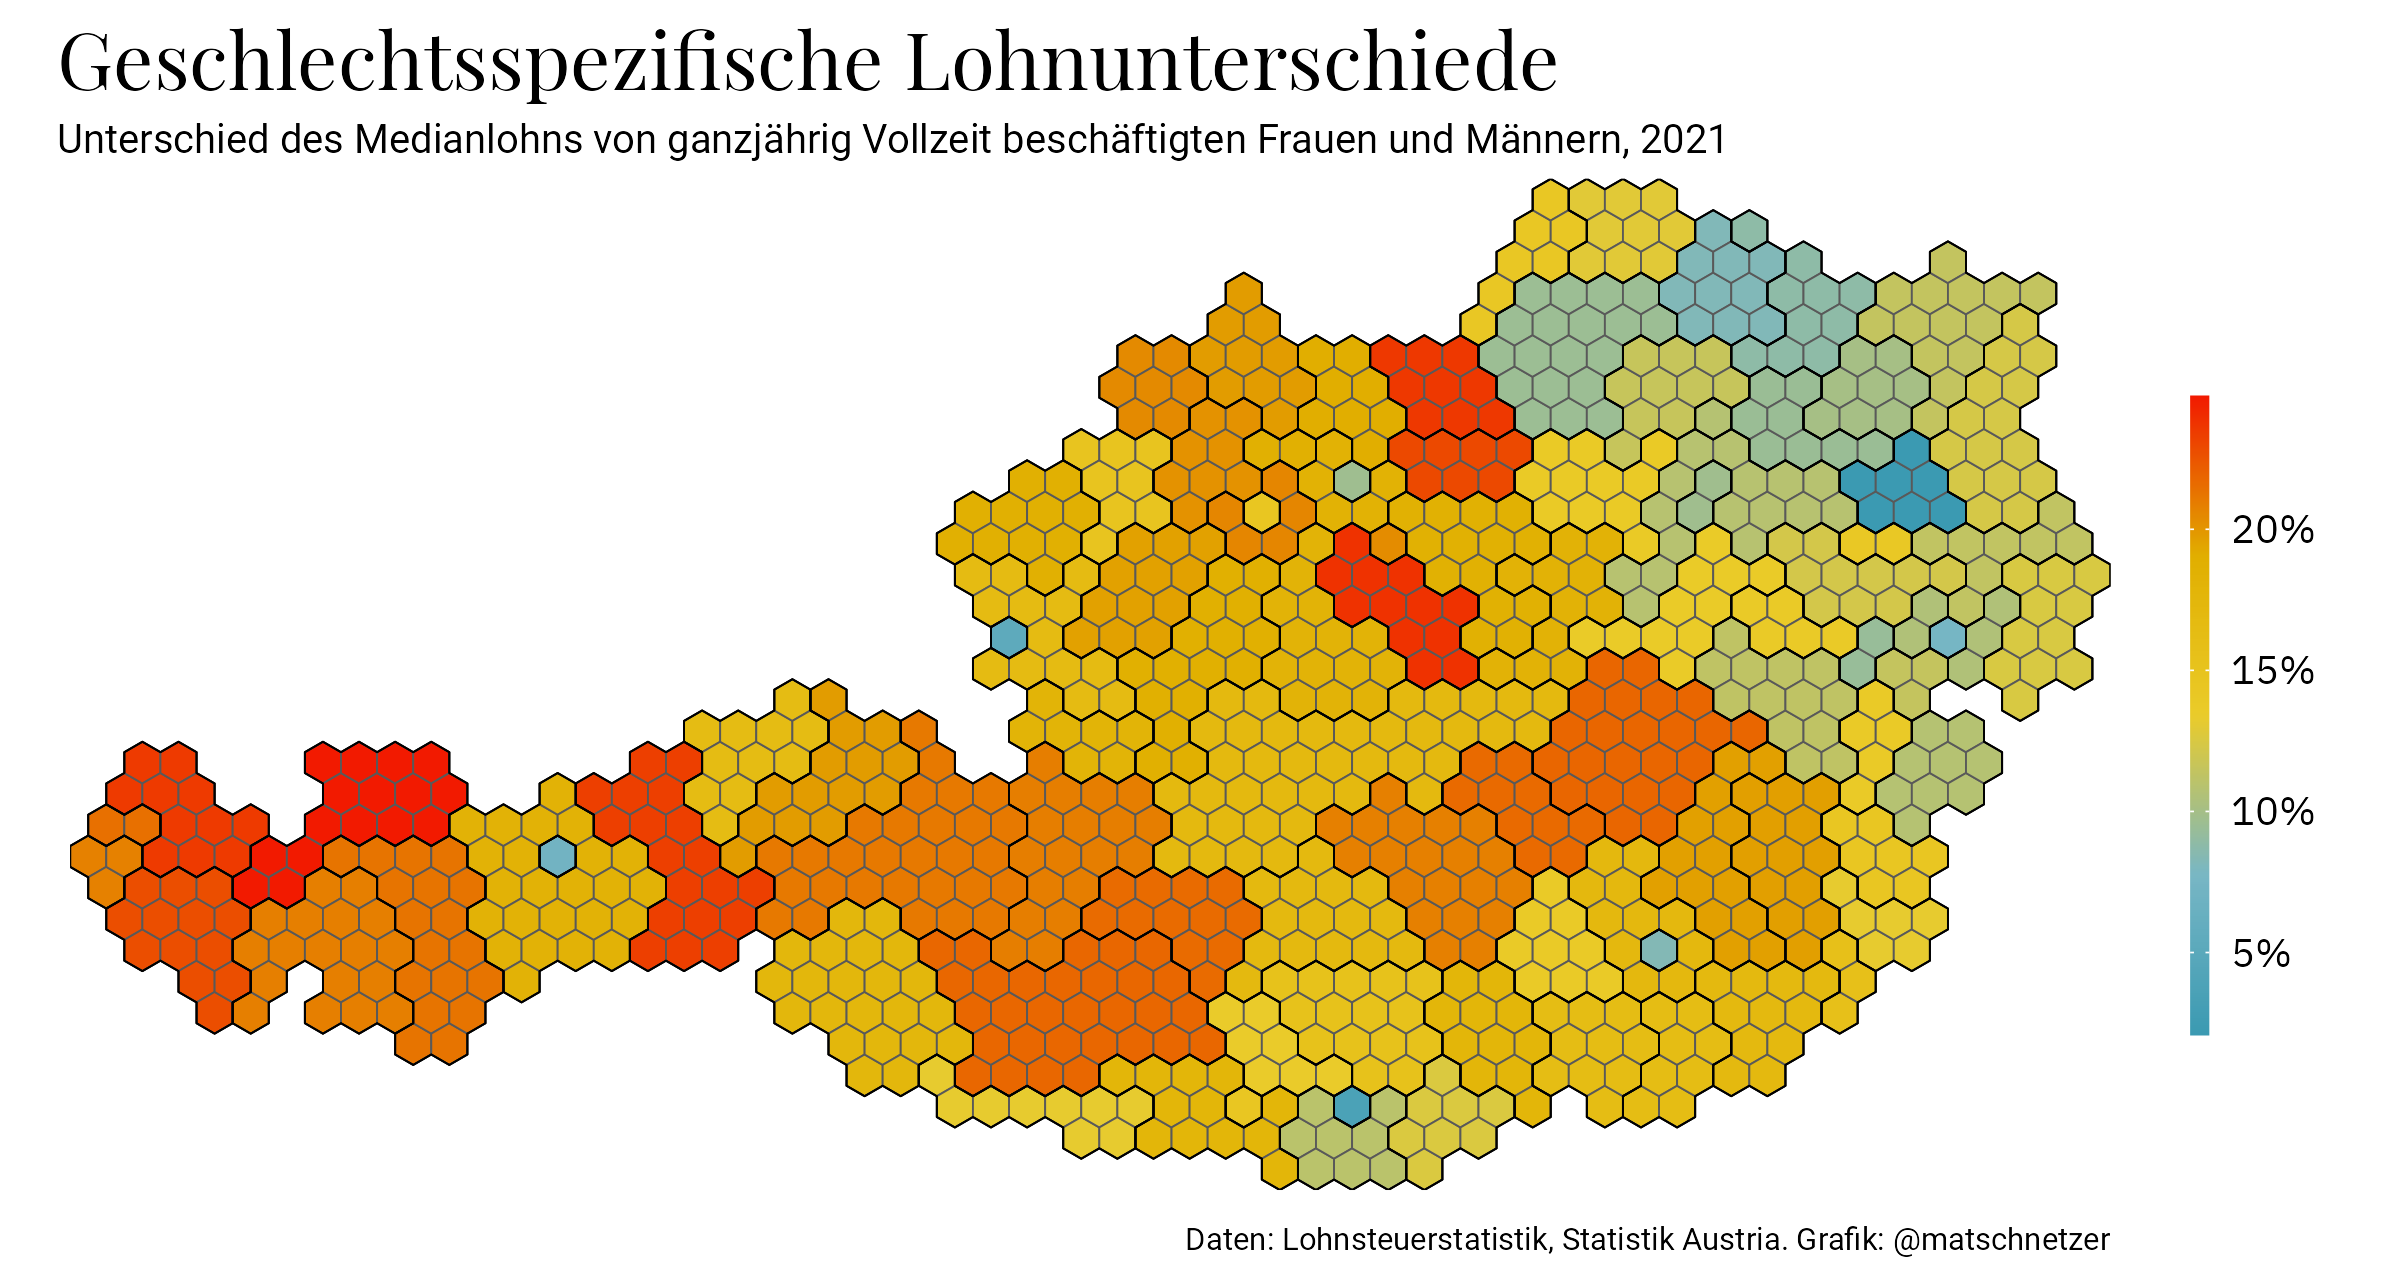
I love visualizing data that attracts public interest. Most of my charts focus on topics that I assess as relevant for the public debate. I explicitly look for reliable statistics that provide interesting insights into social, economic, and ecological issues.
Visualizing data
I mainly work in the fabulous ggplot universe in R. Much of my work is inspired by innovative colleagues who generously share their ideas and code in social networks. In particular, I learn a lot from the #tidytuesday community. The code for my figures is mostly available on Github.
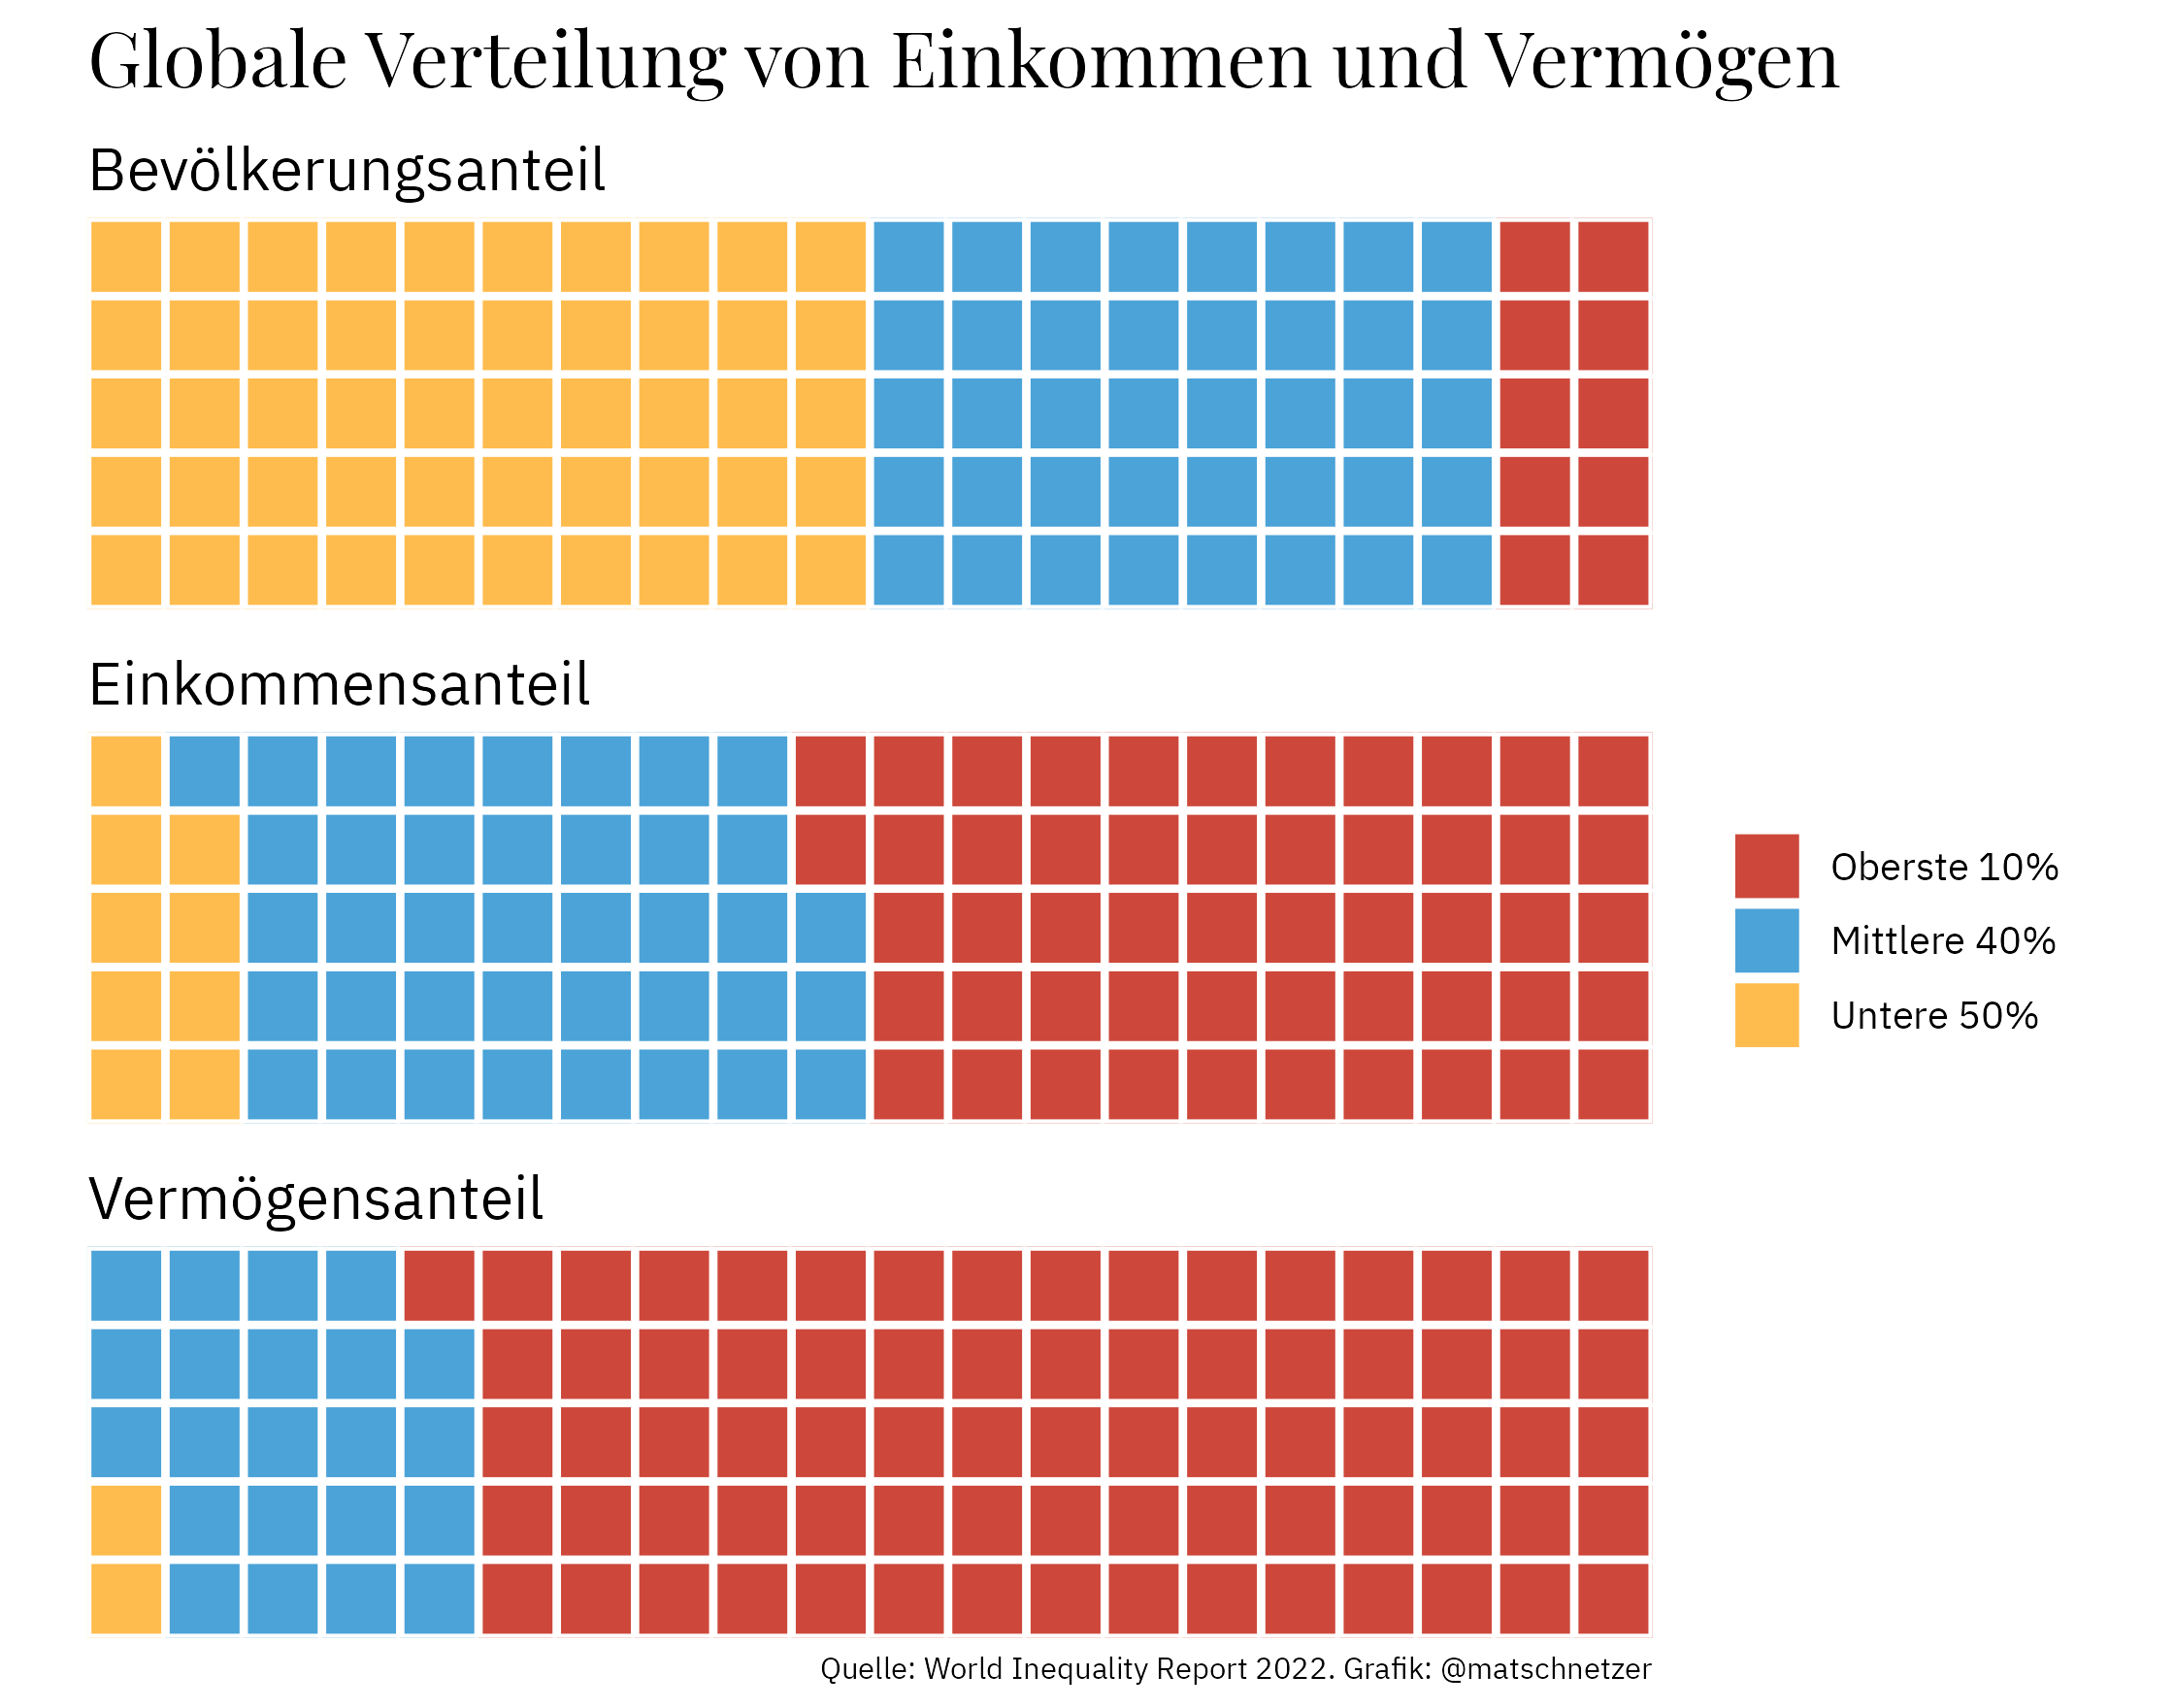
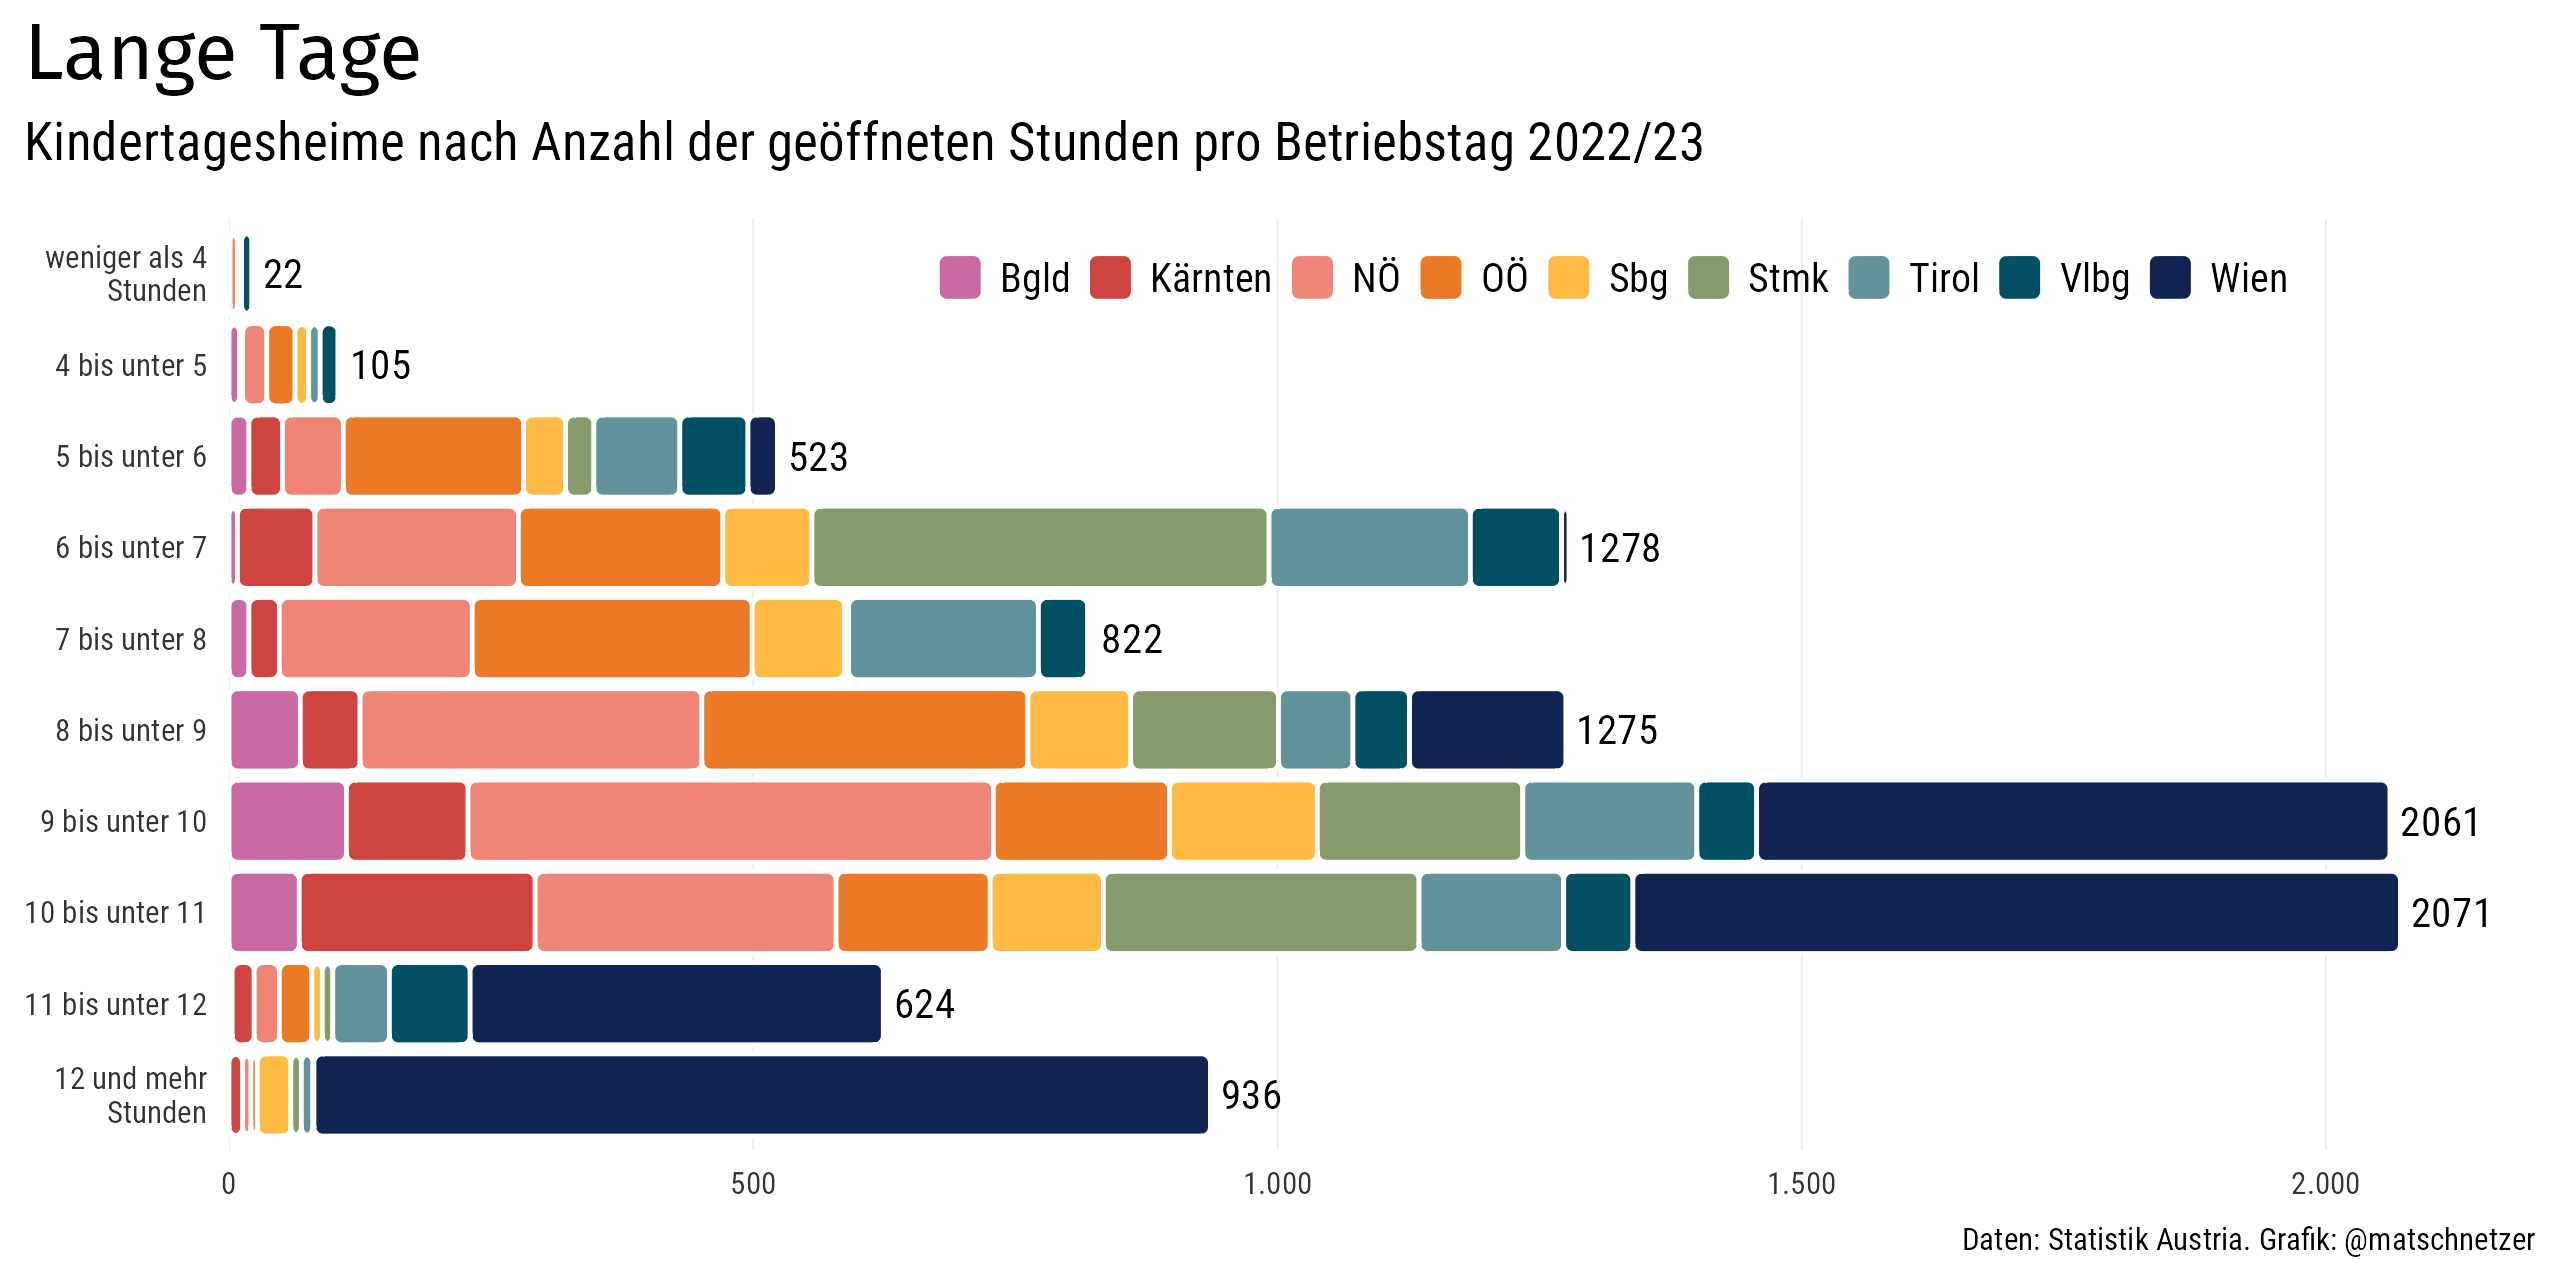
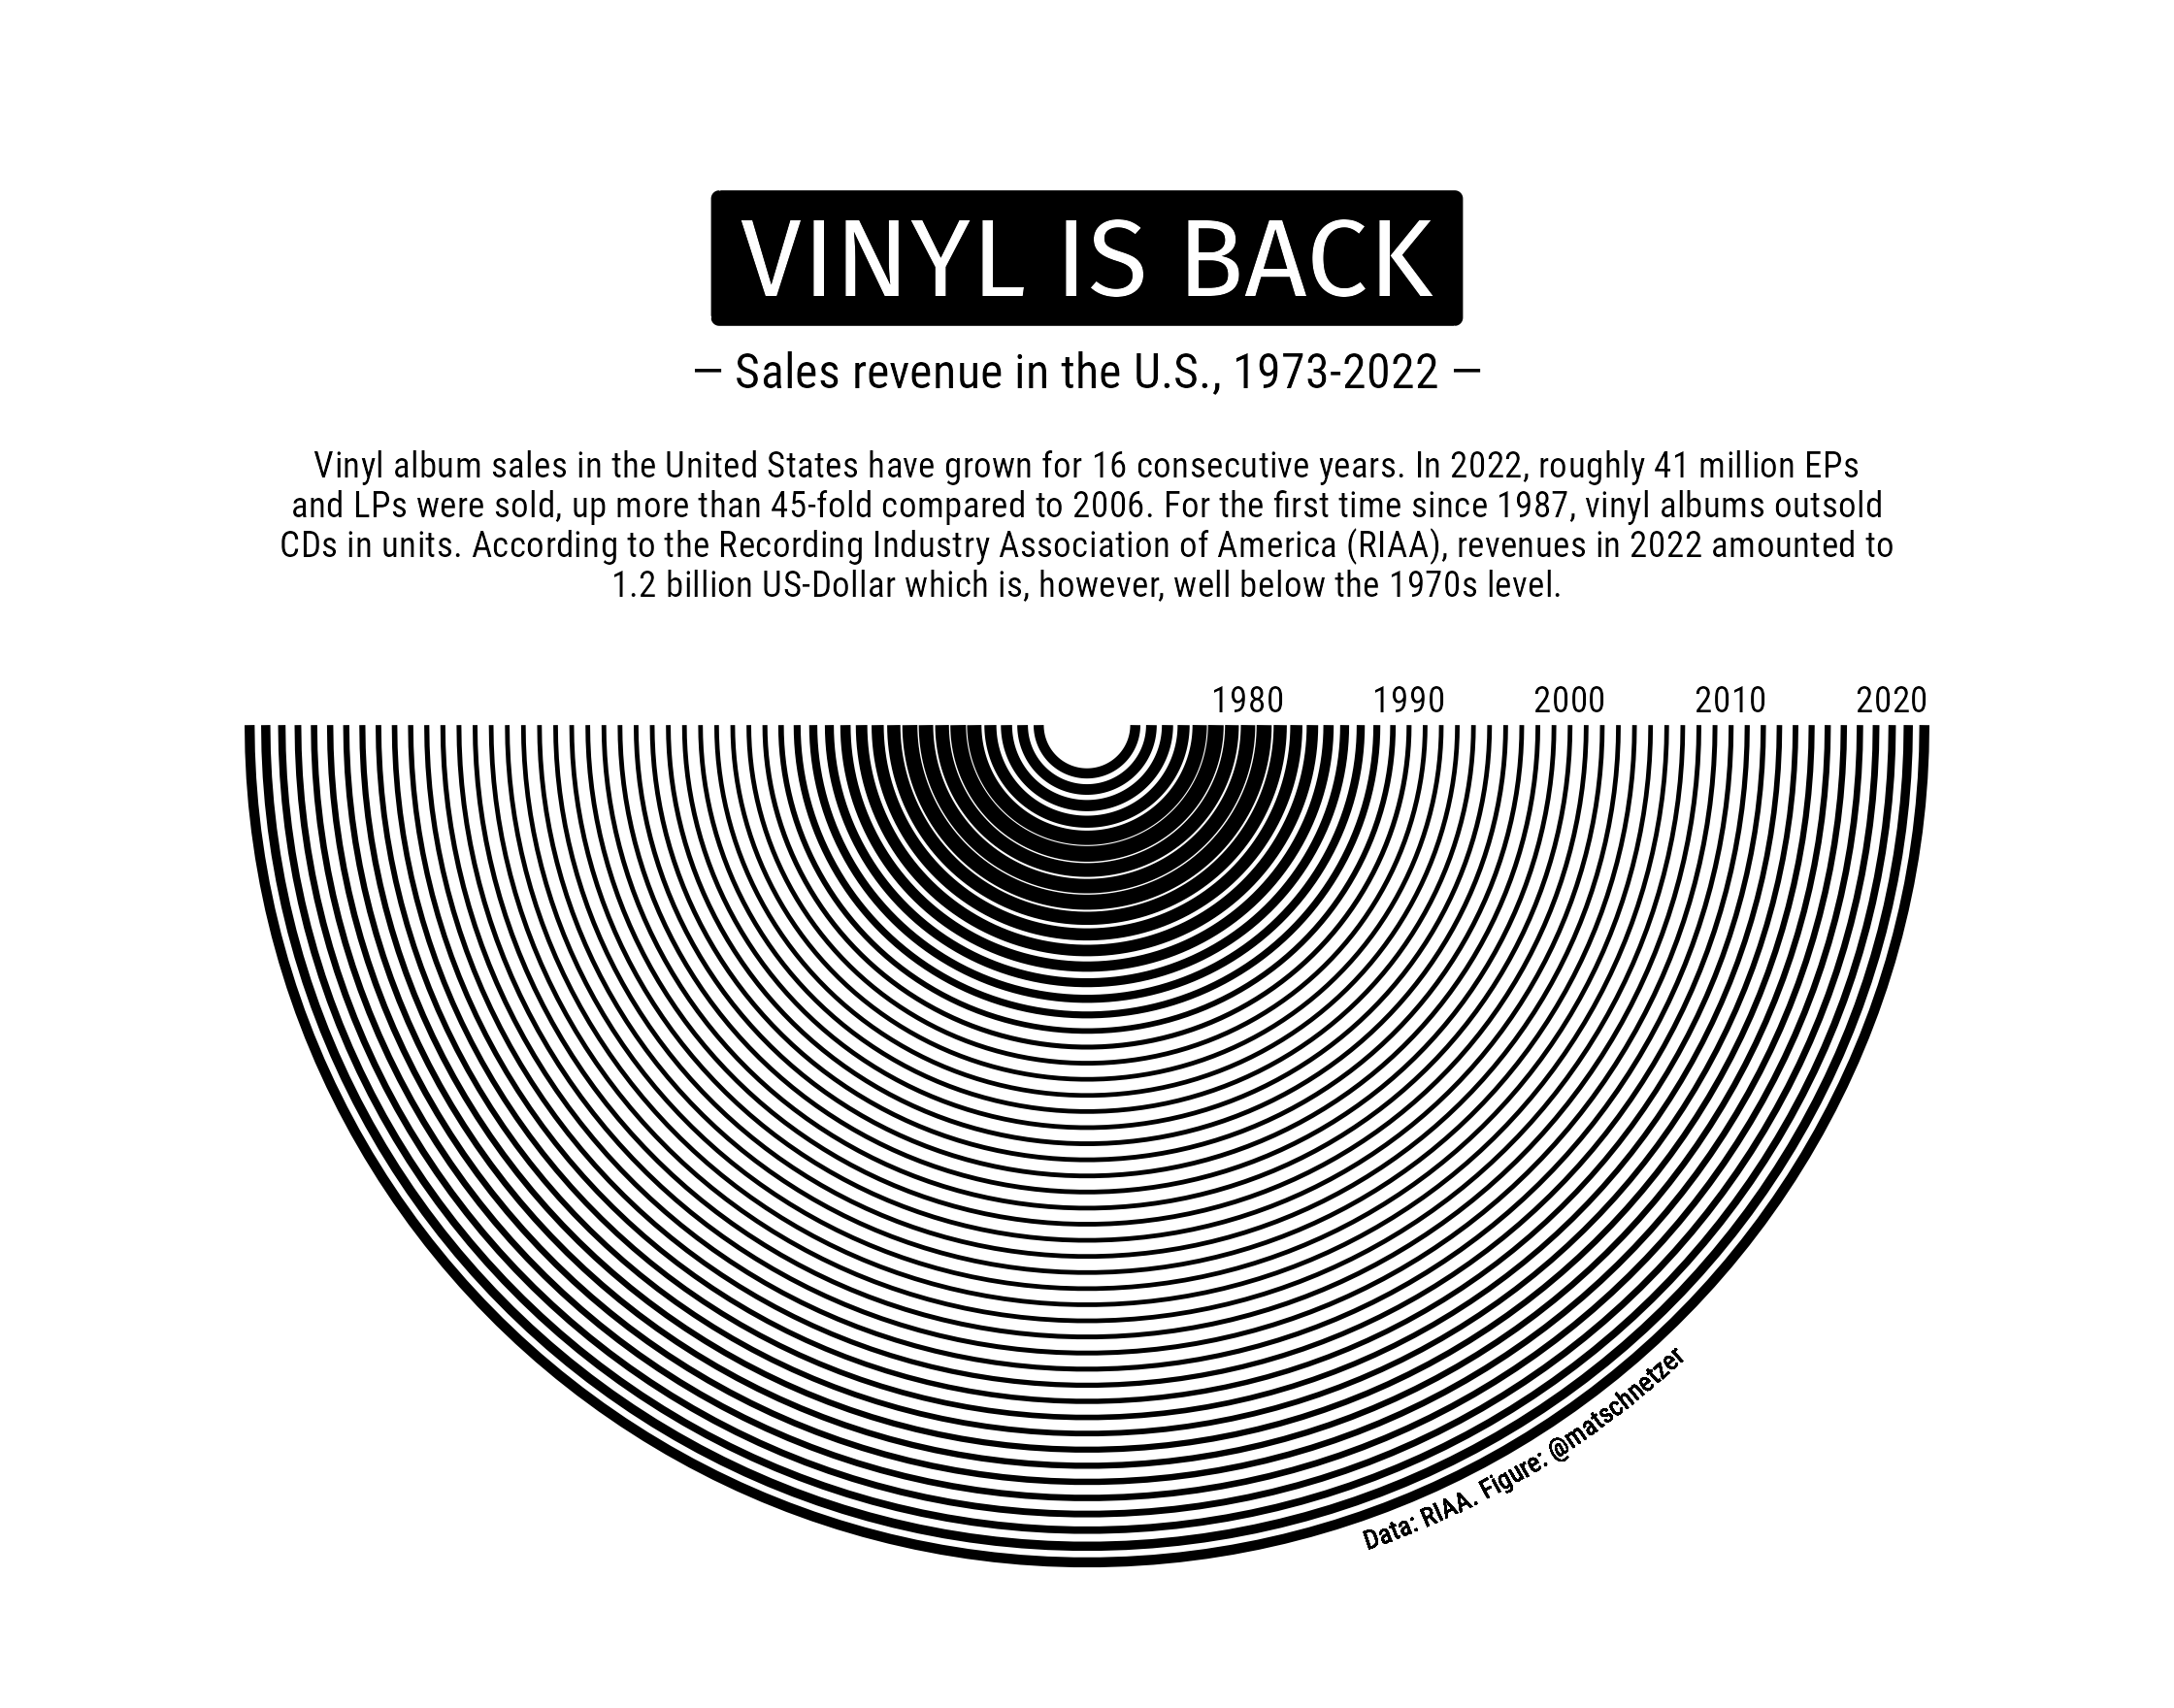
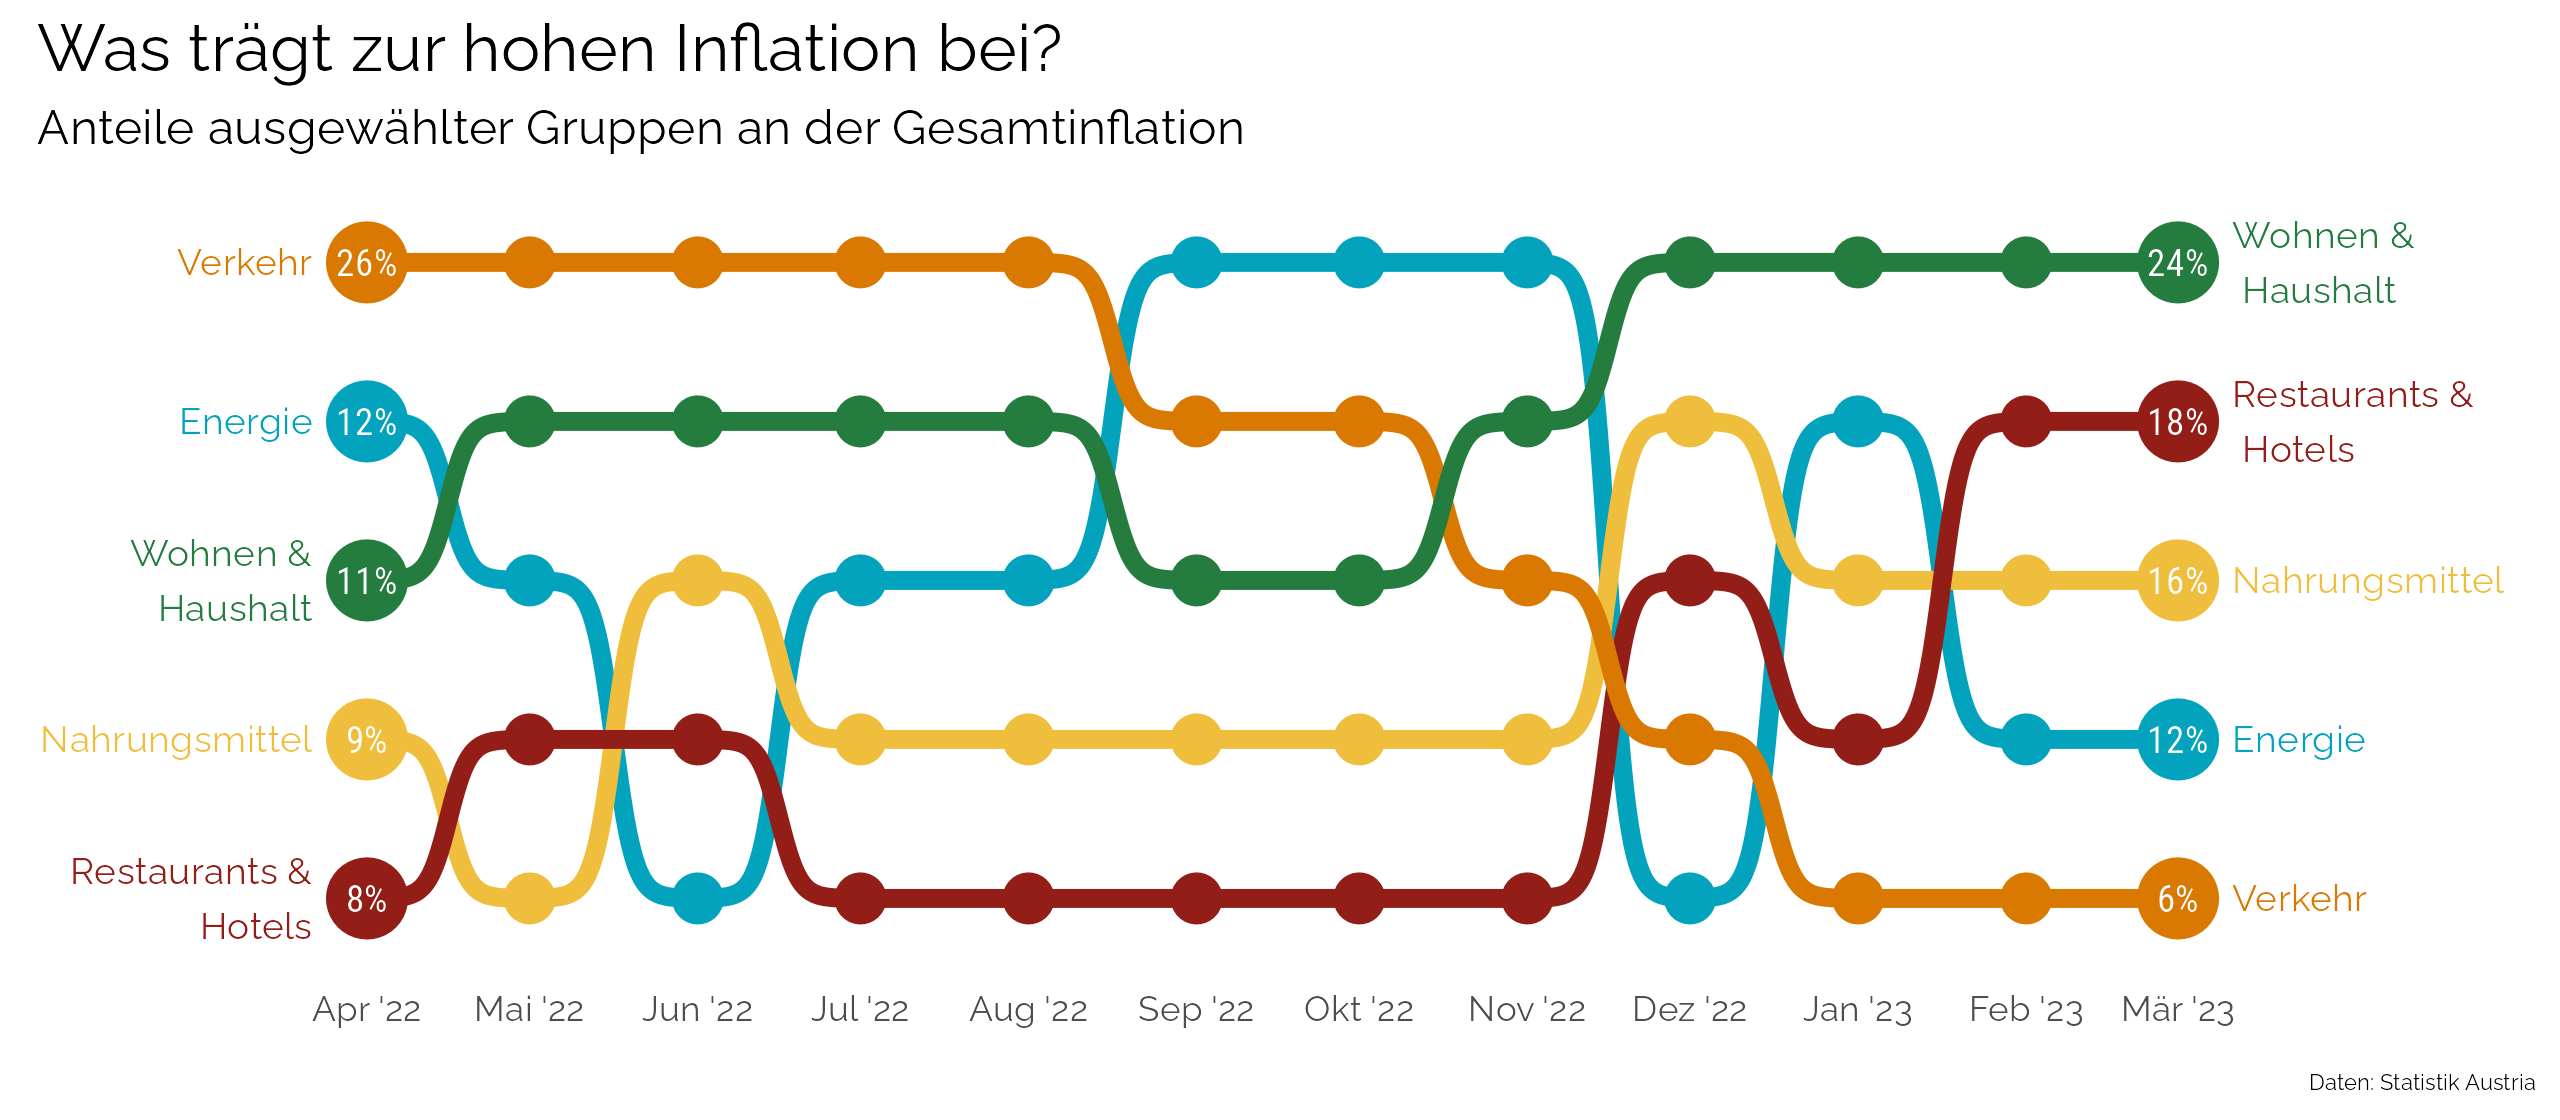
Selected plots
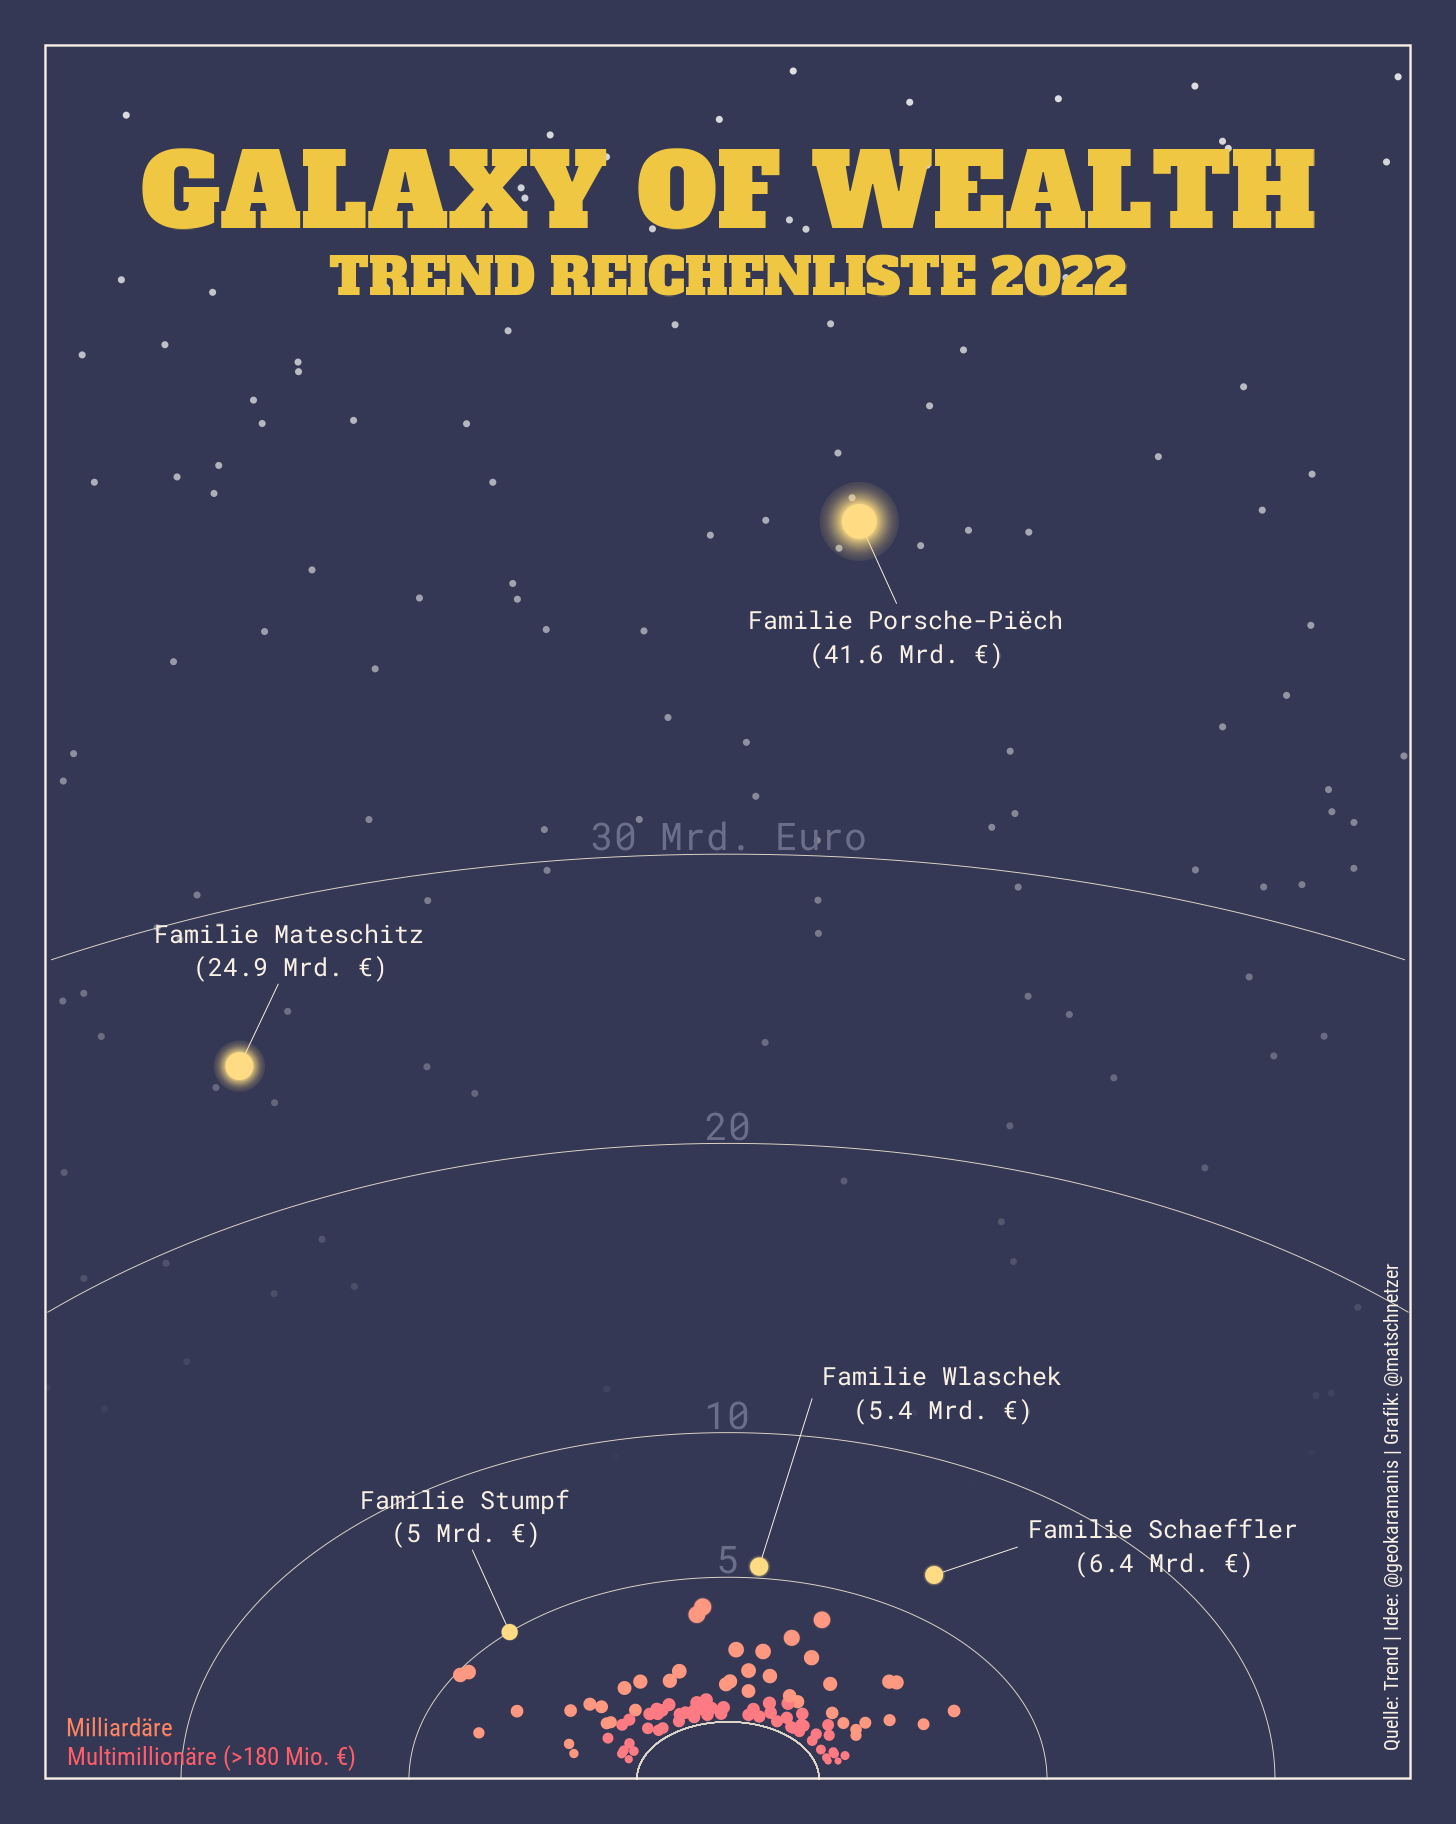
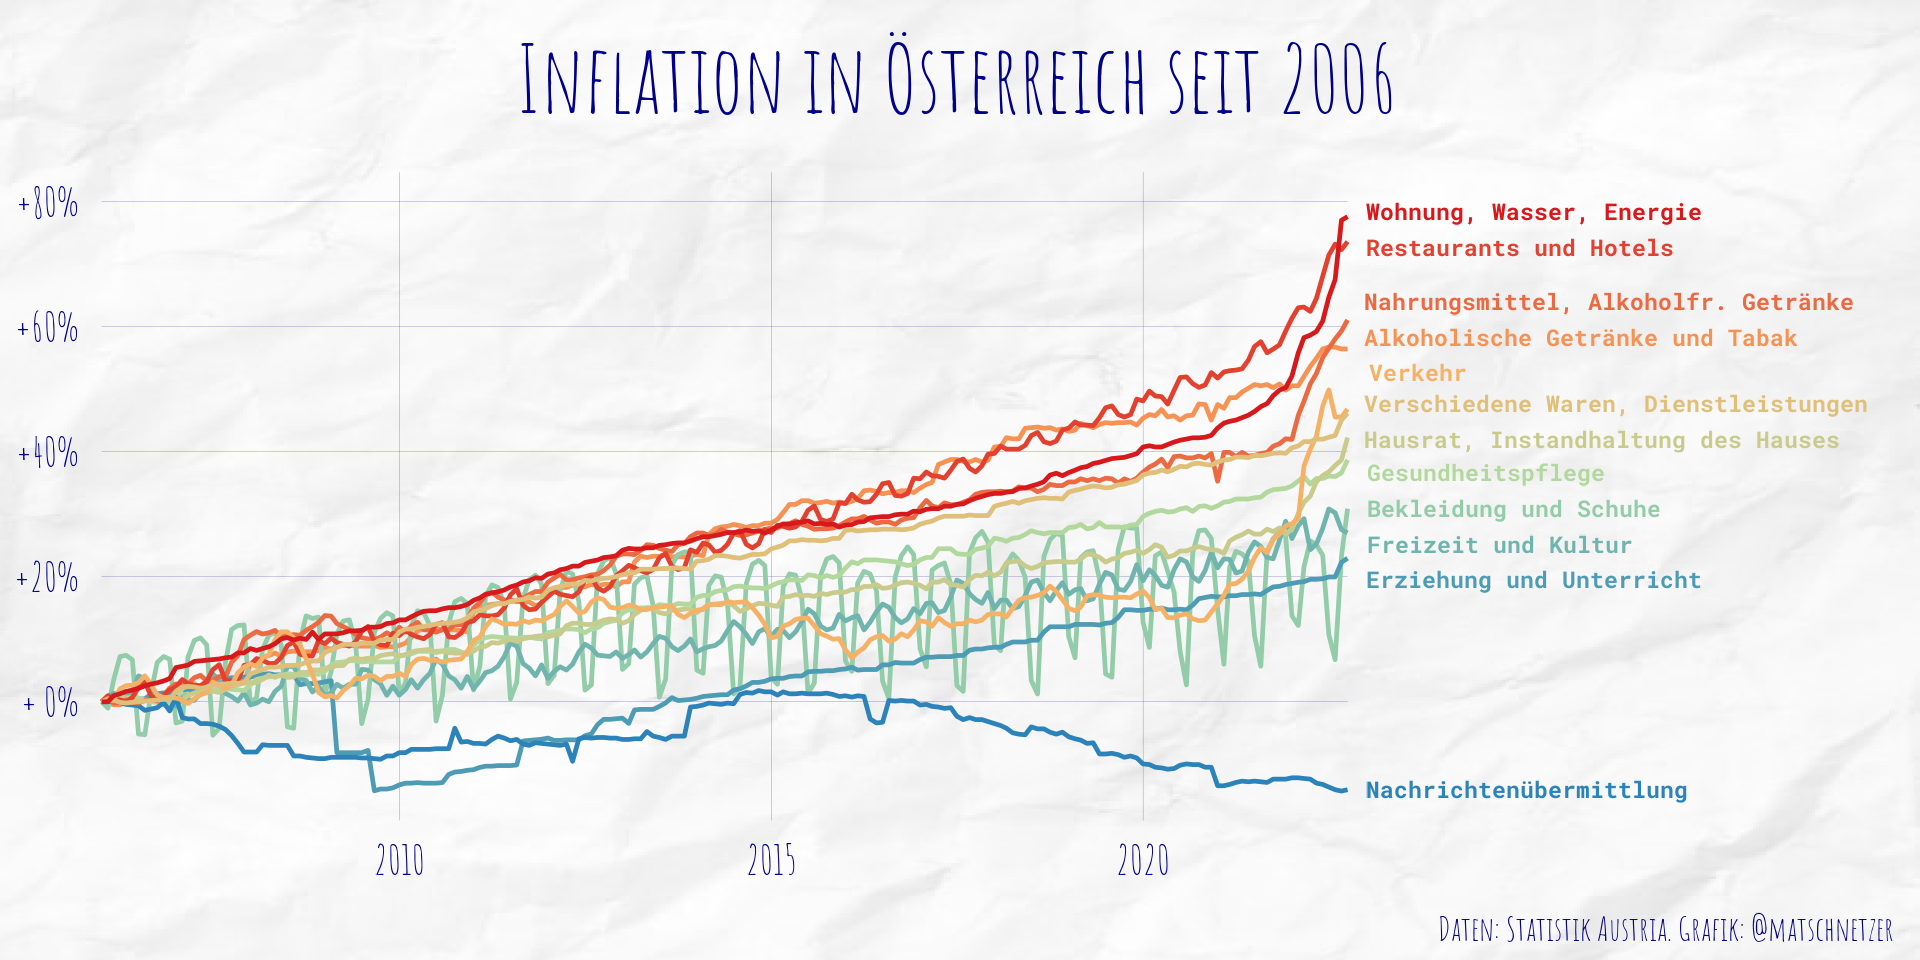
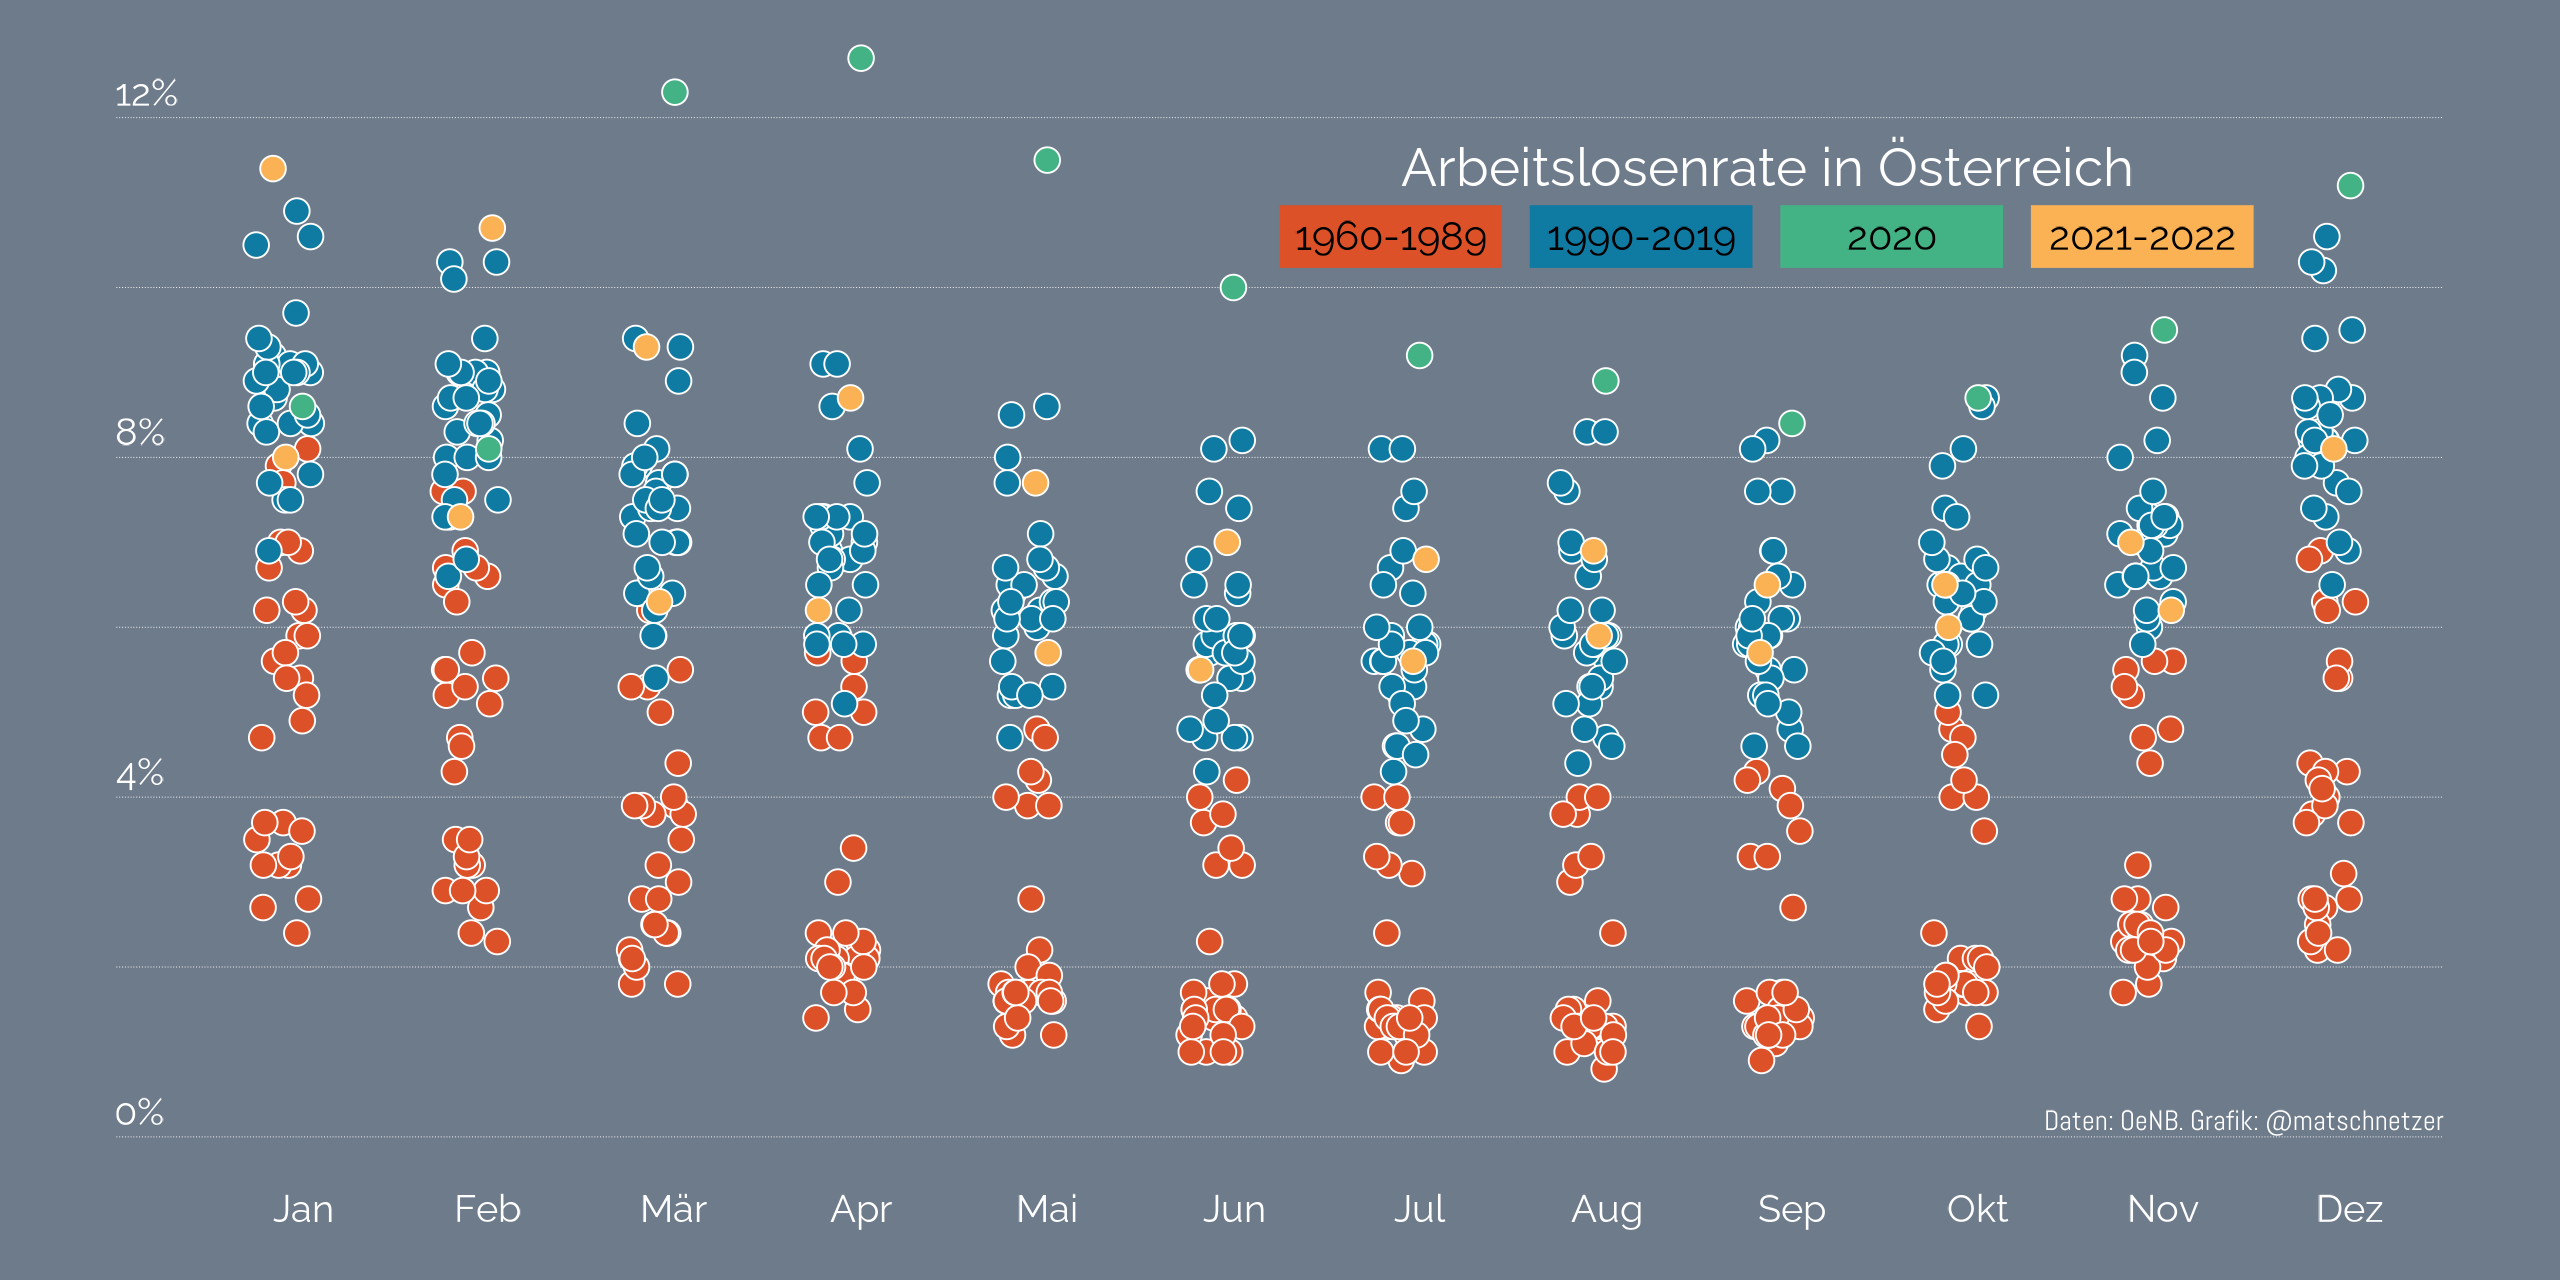
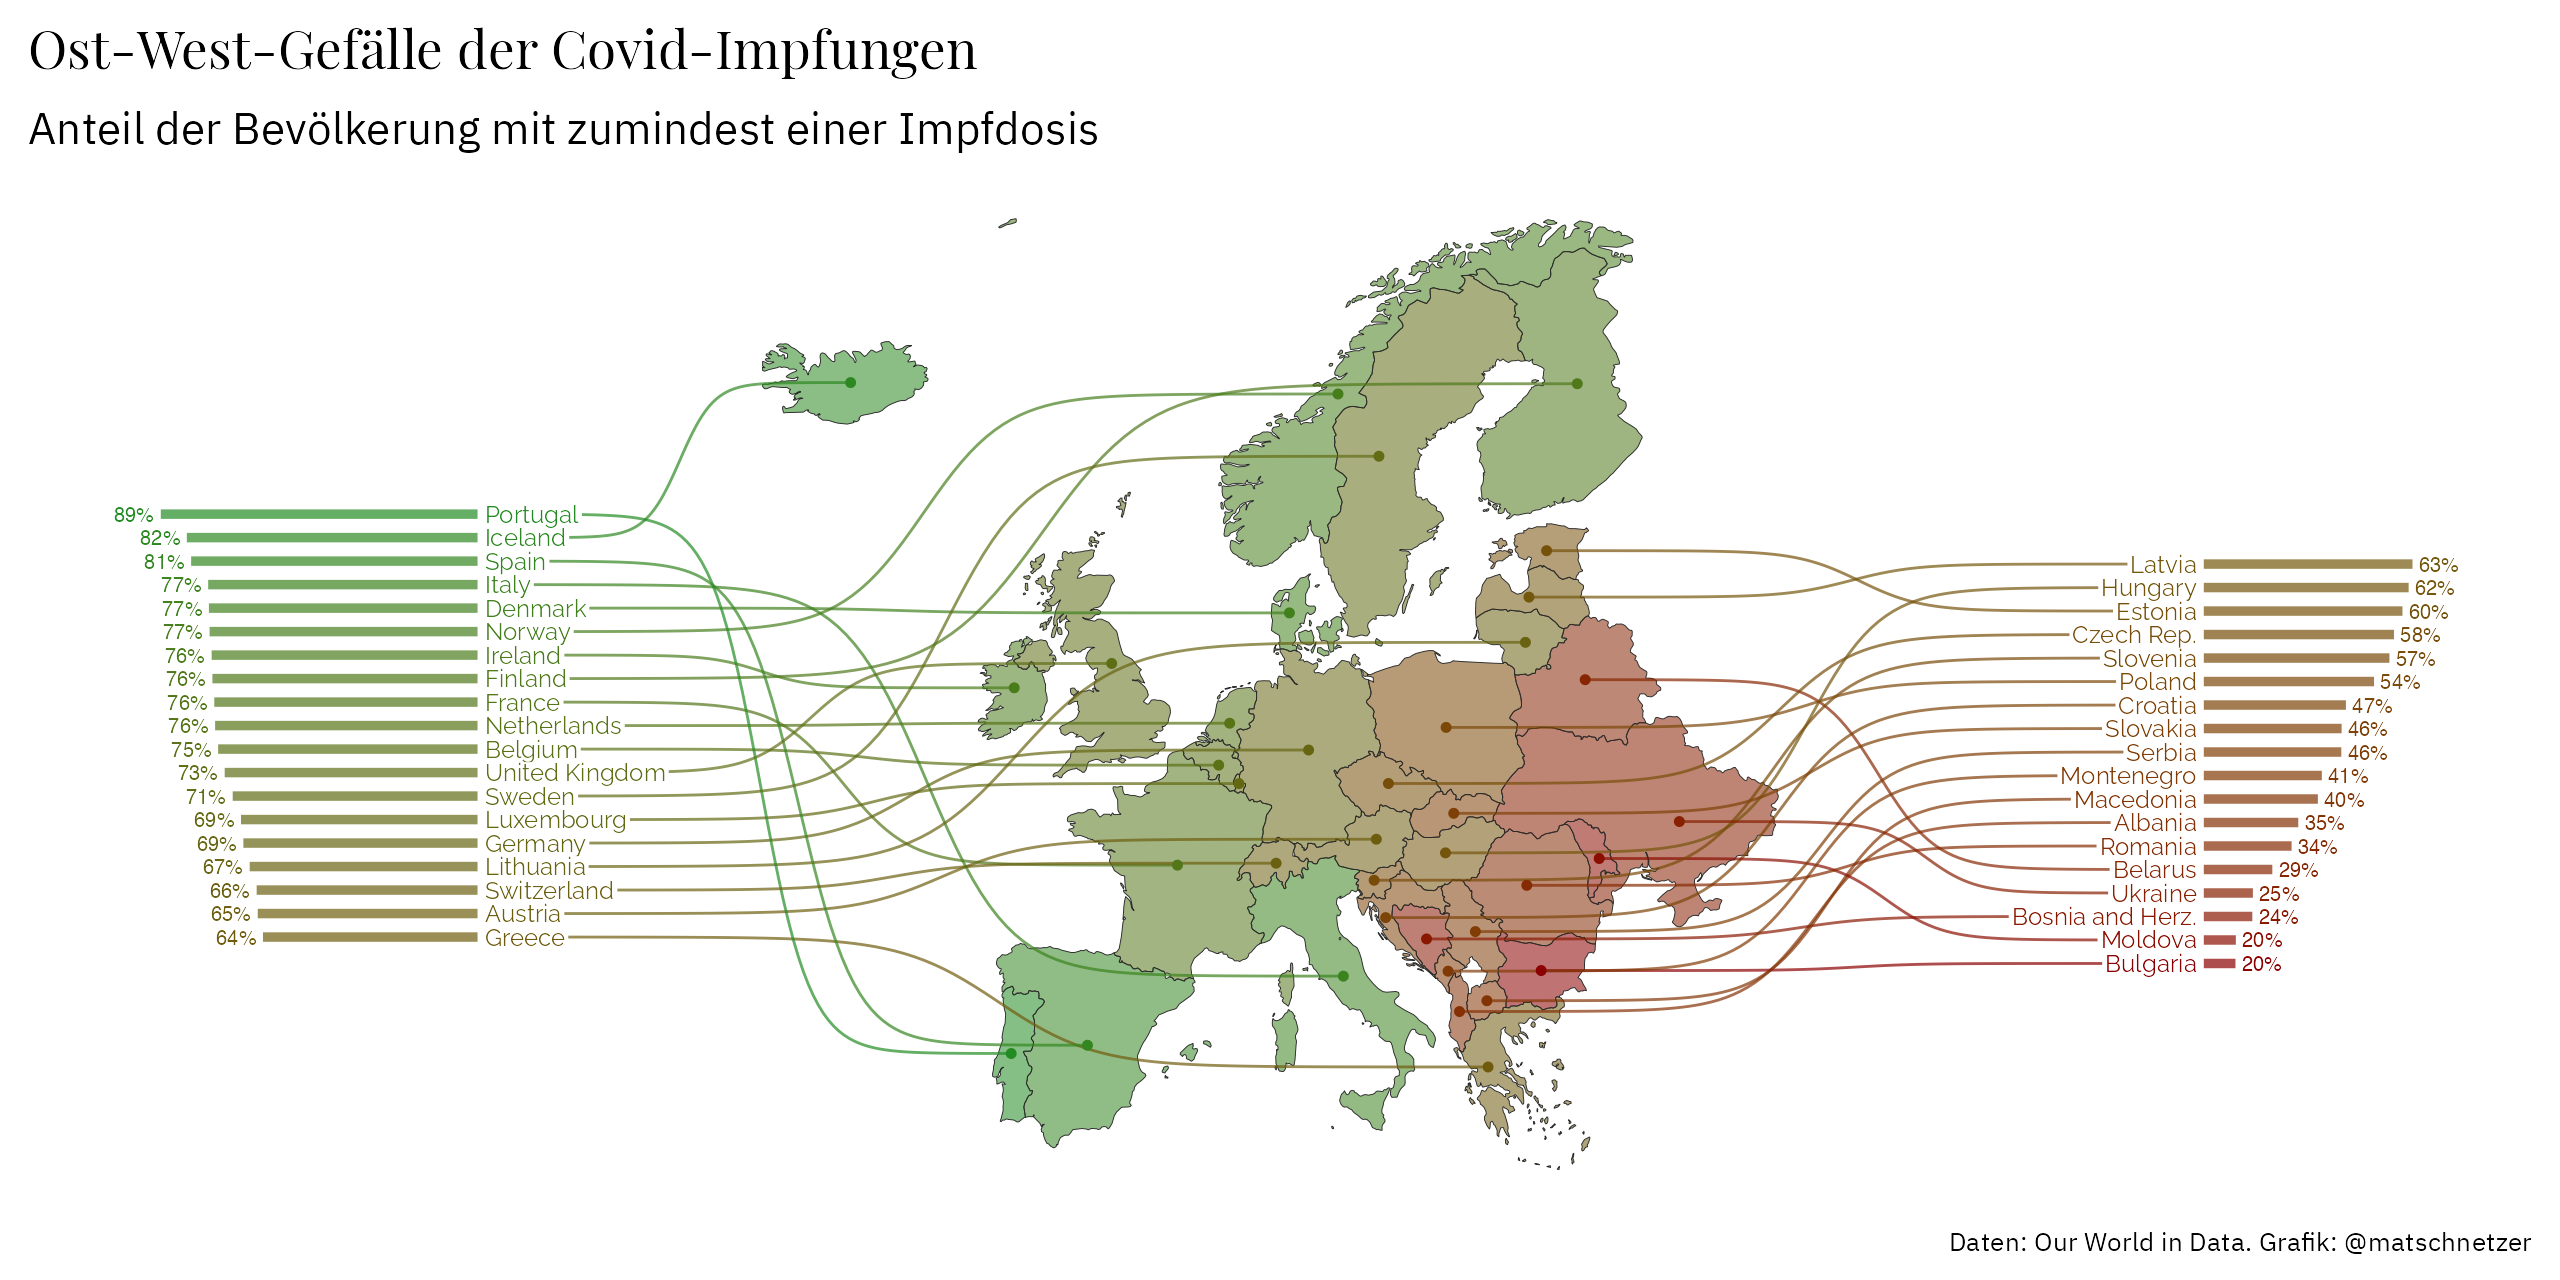
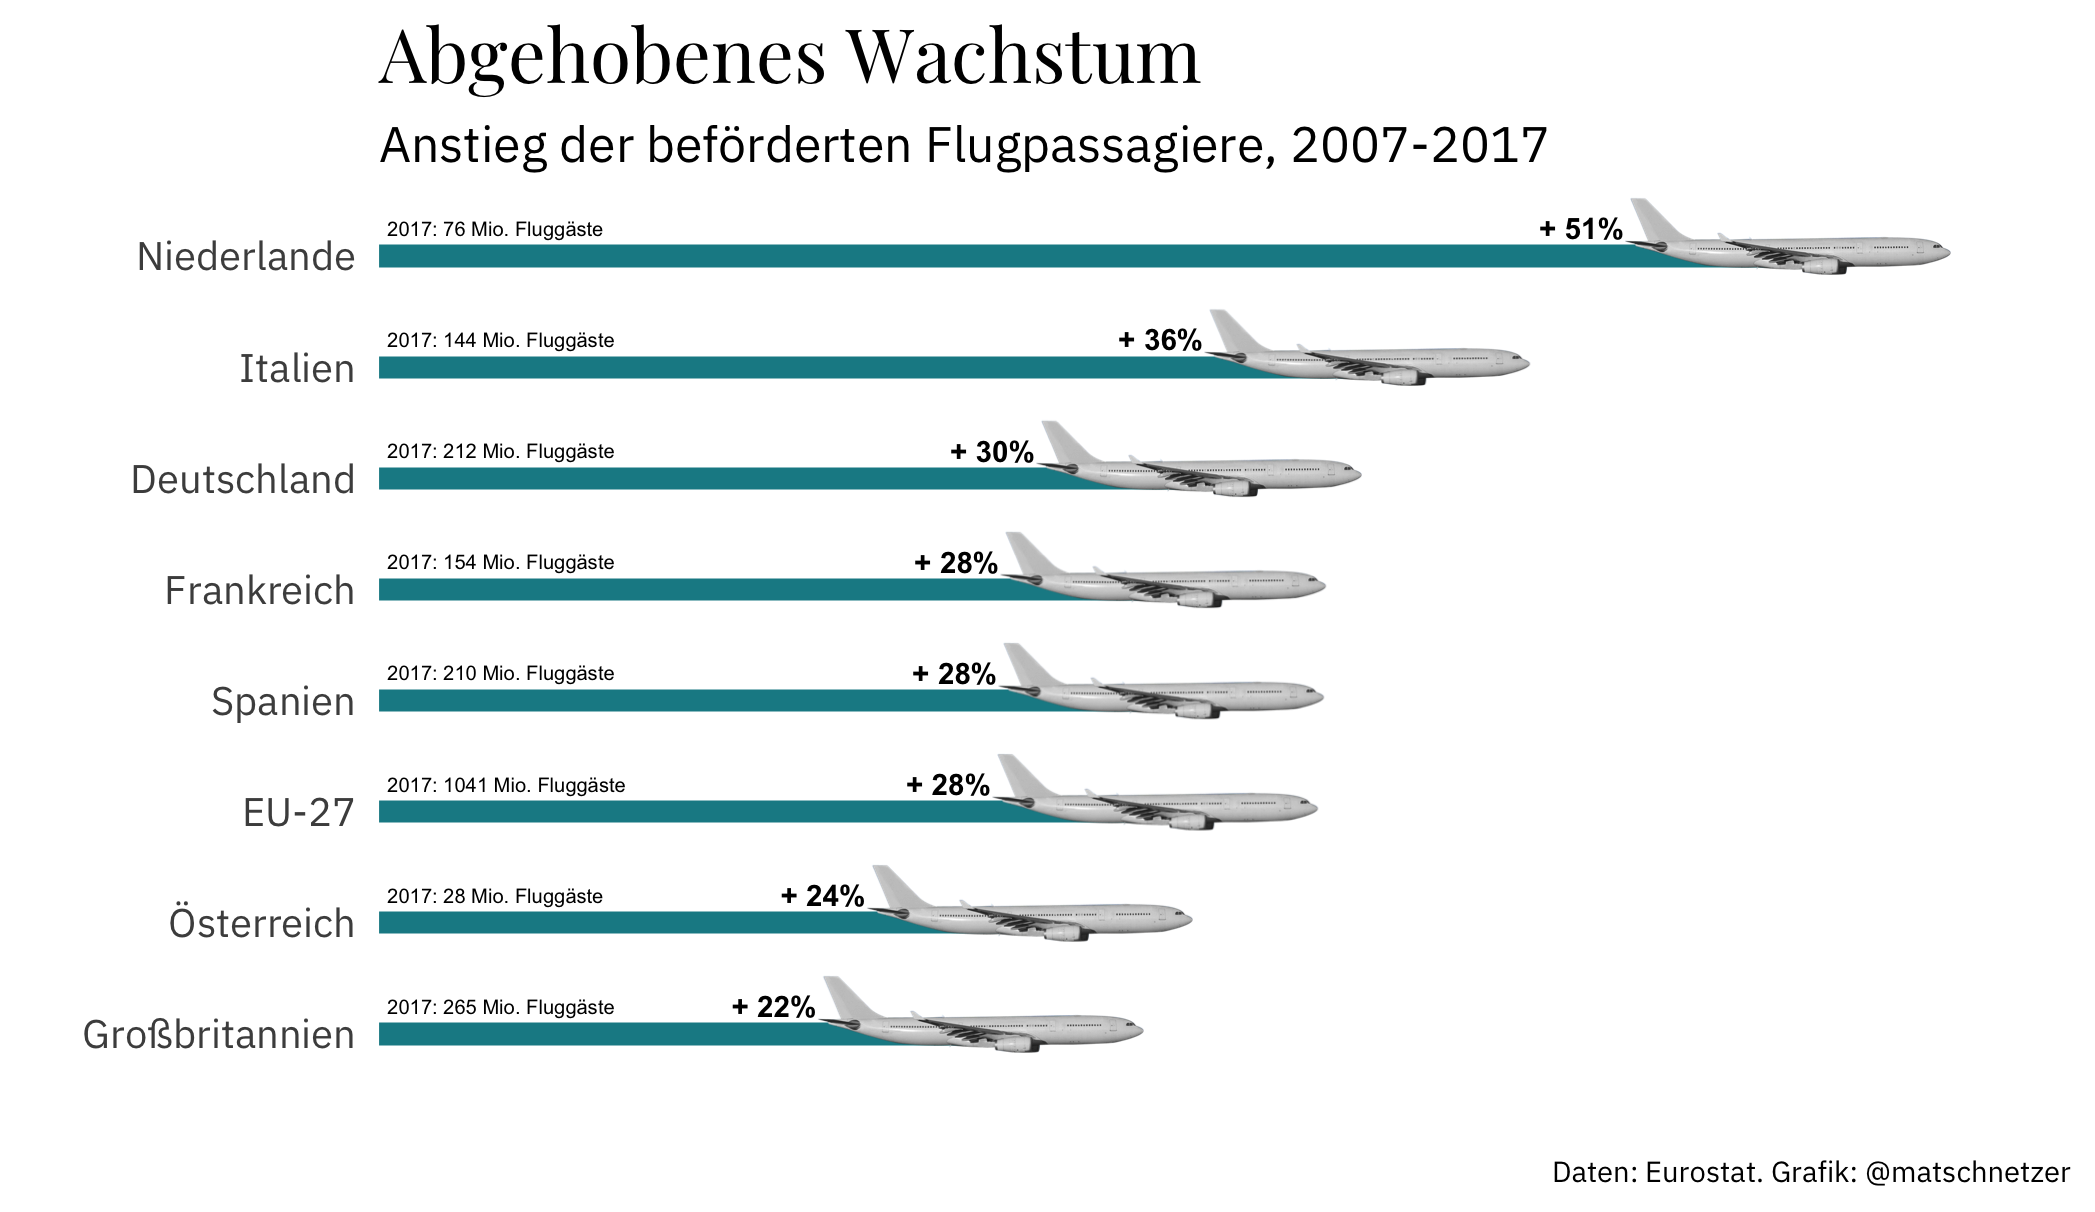
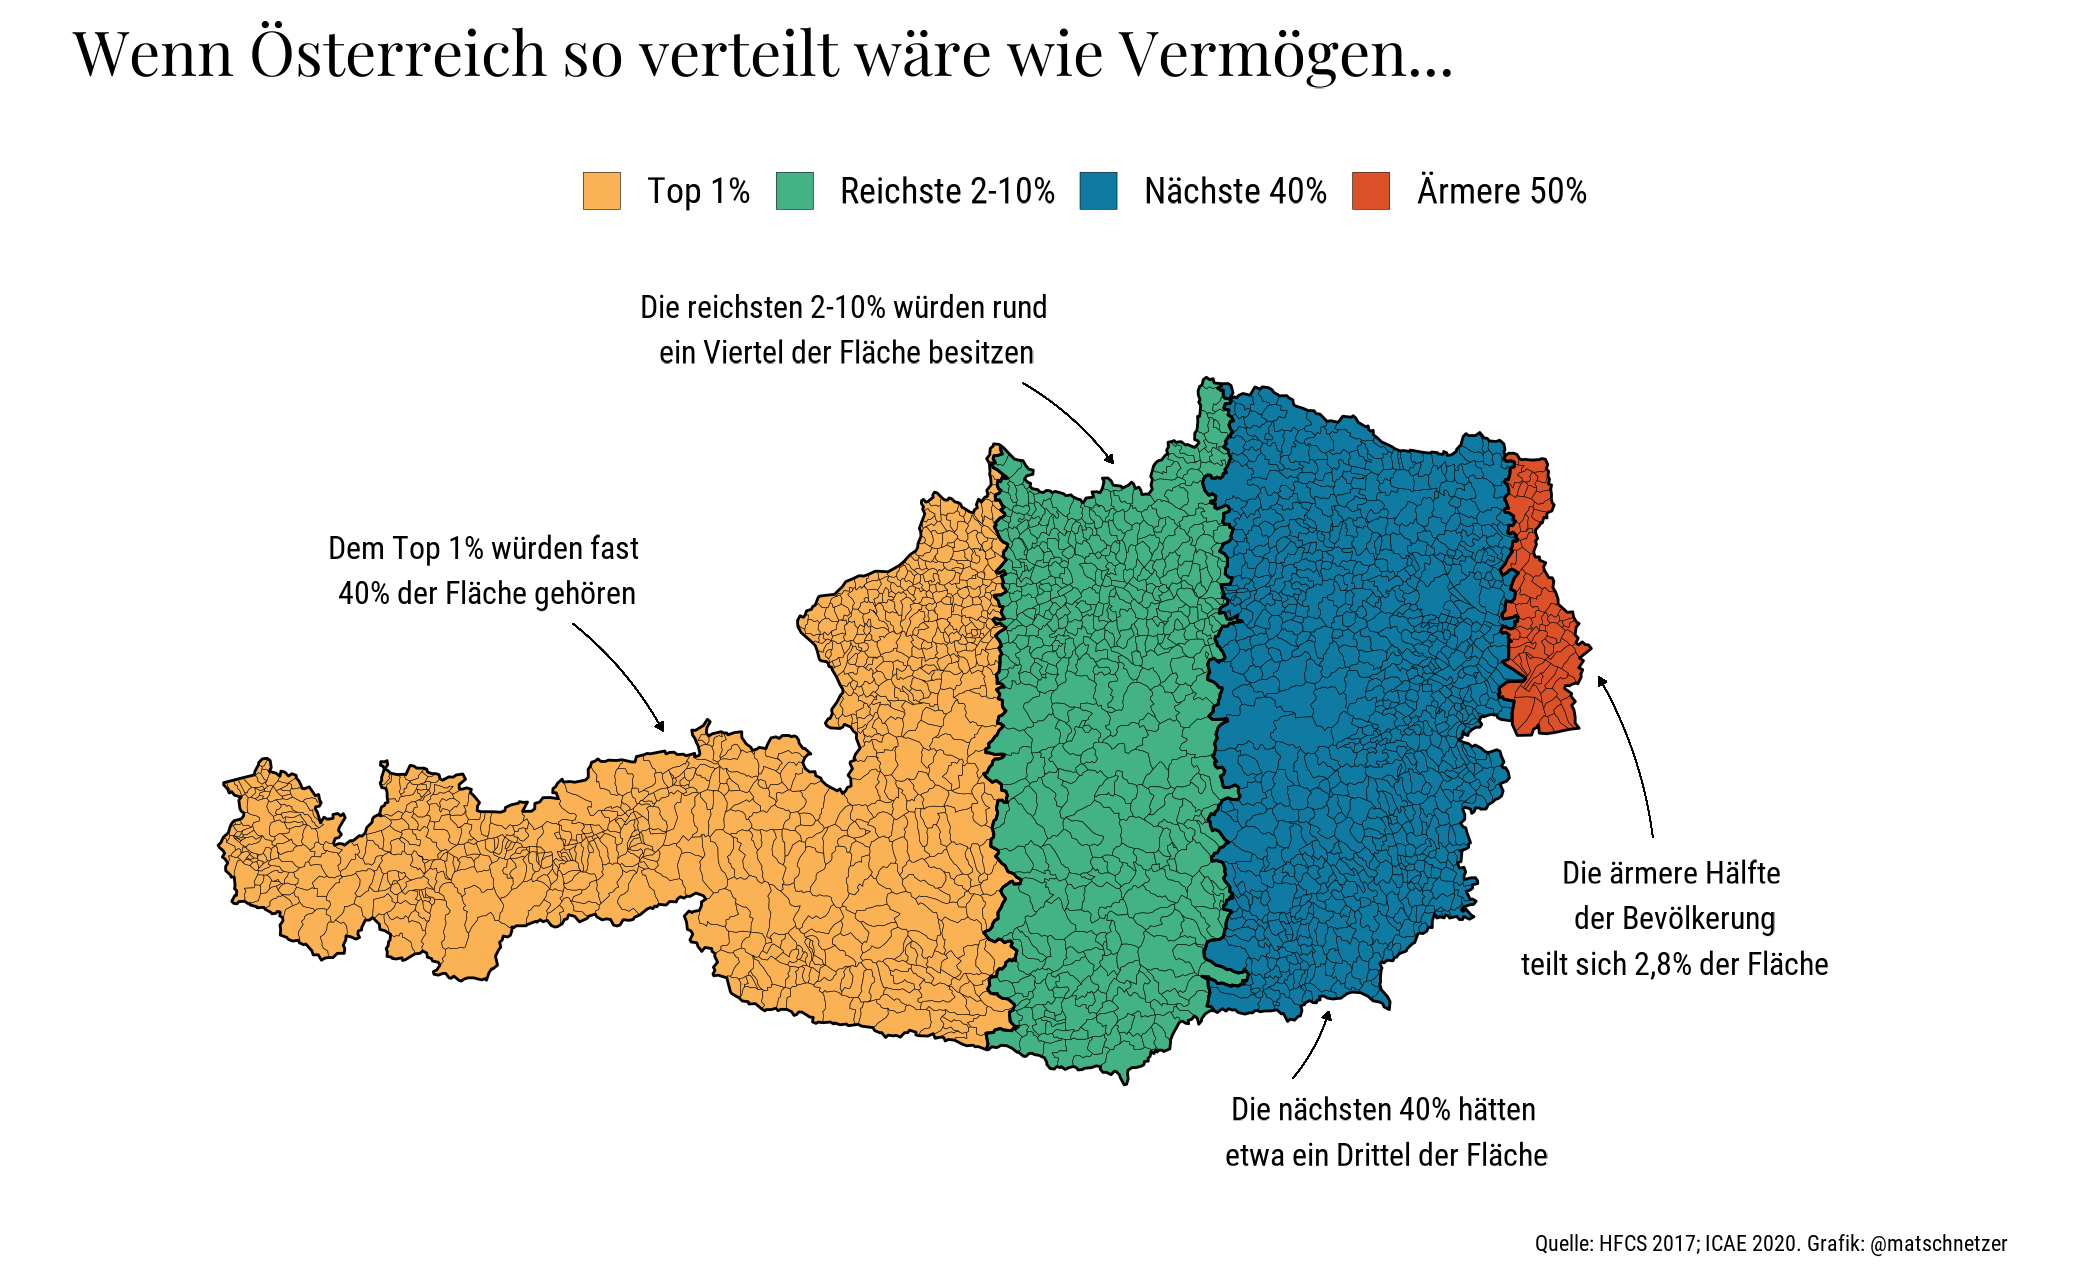
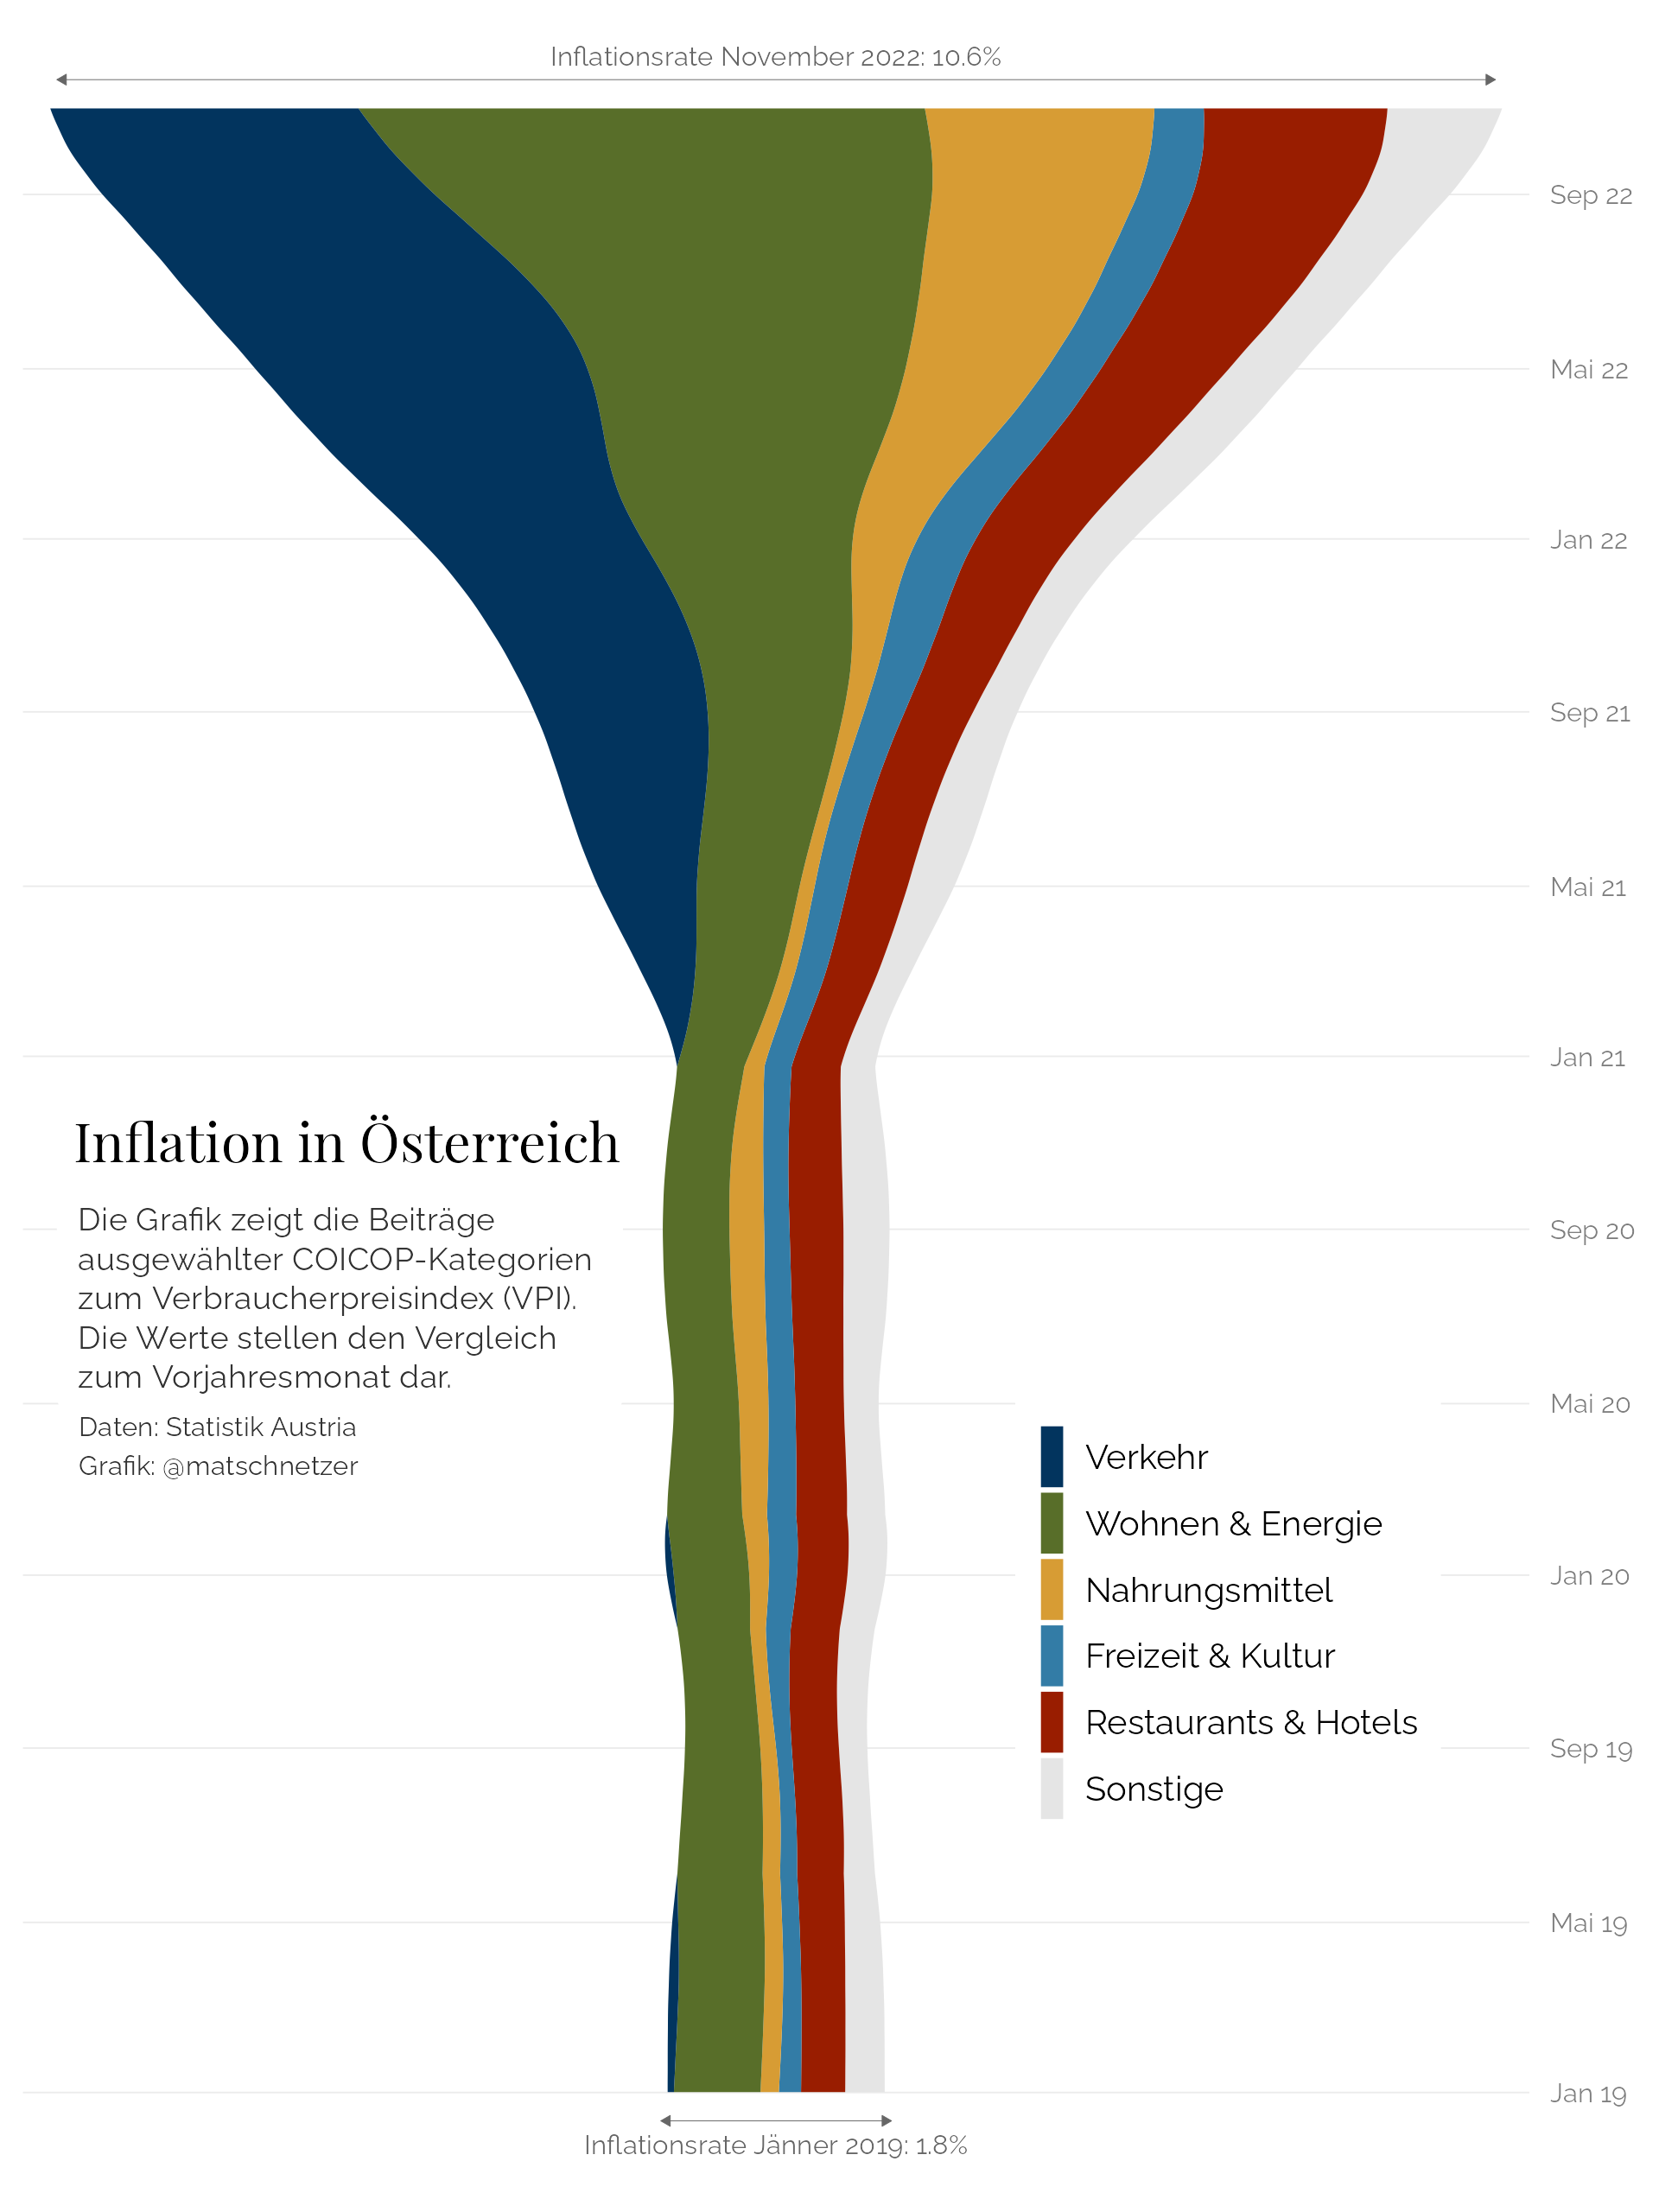
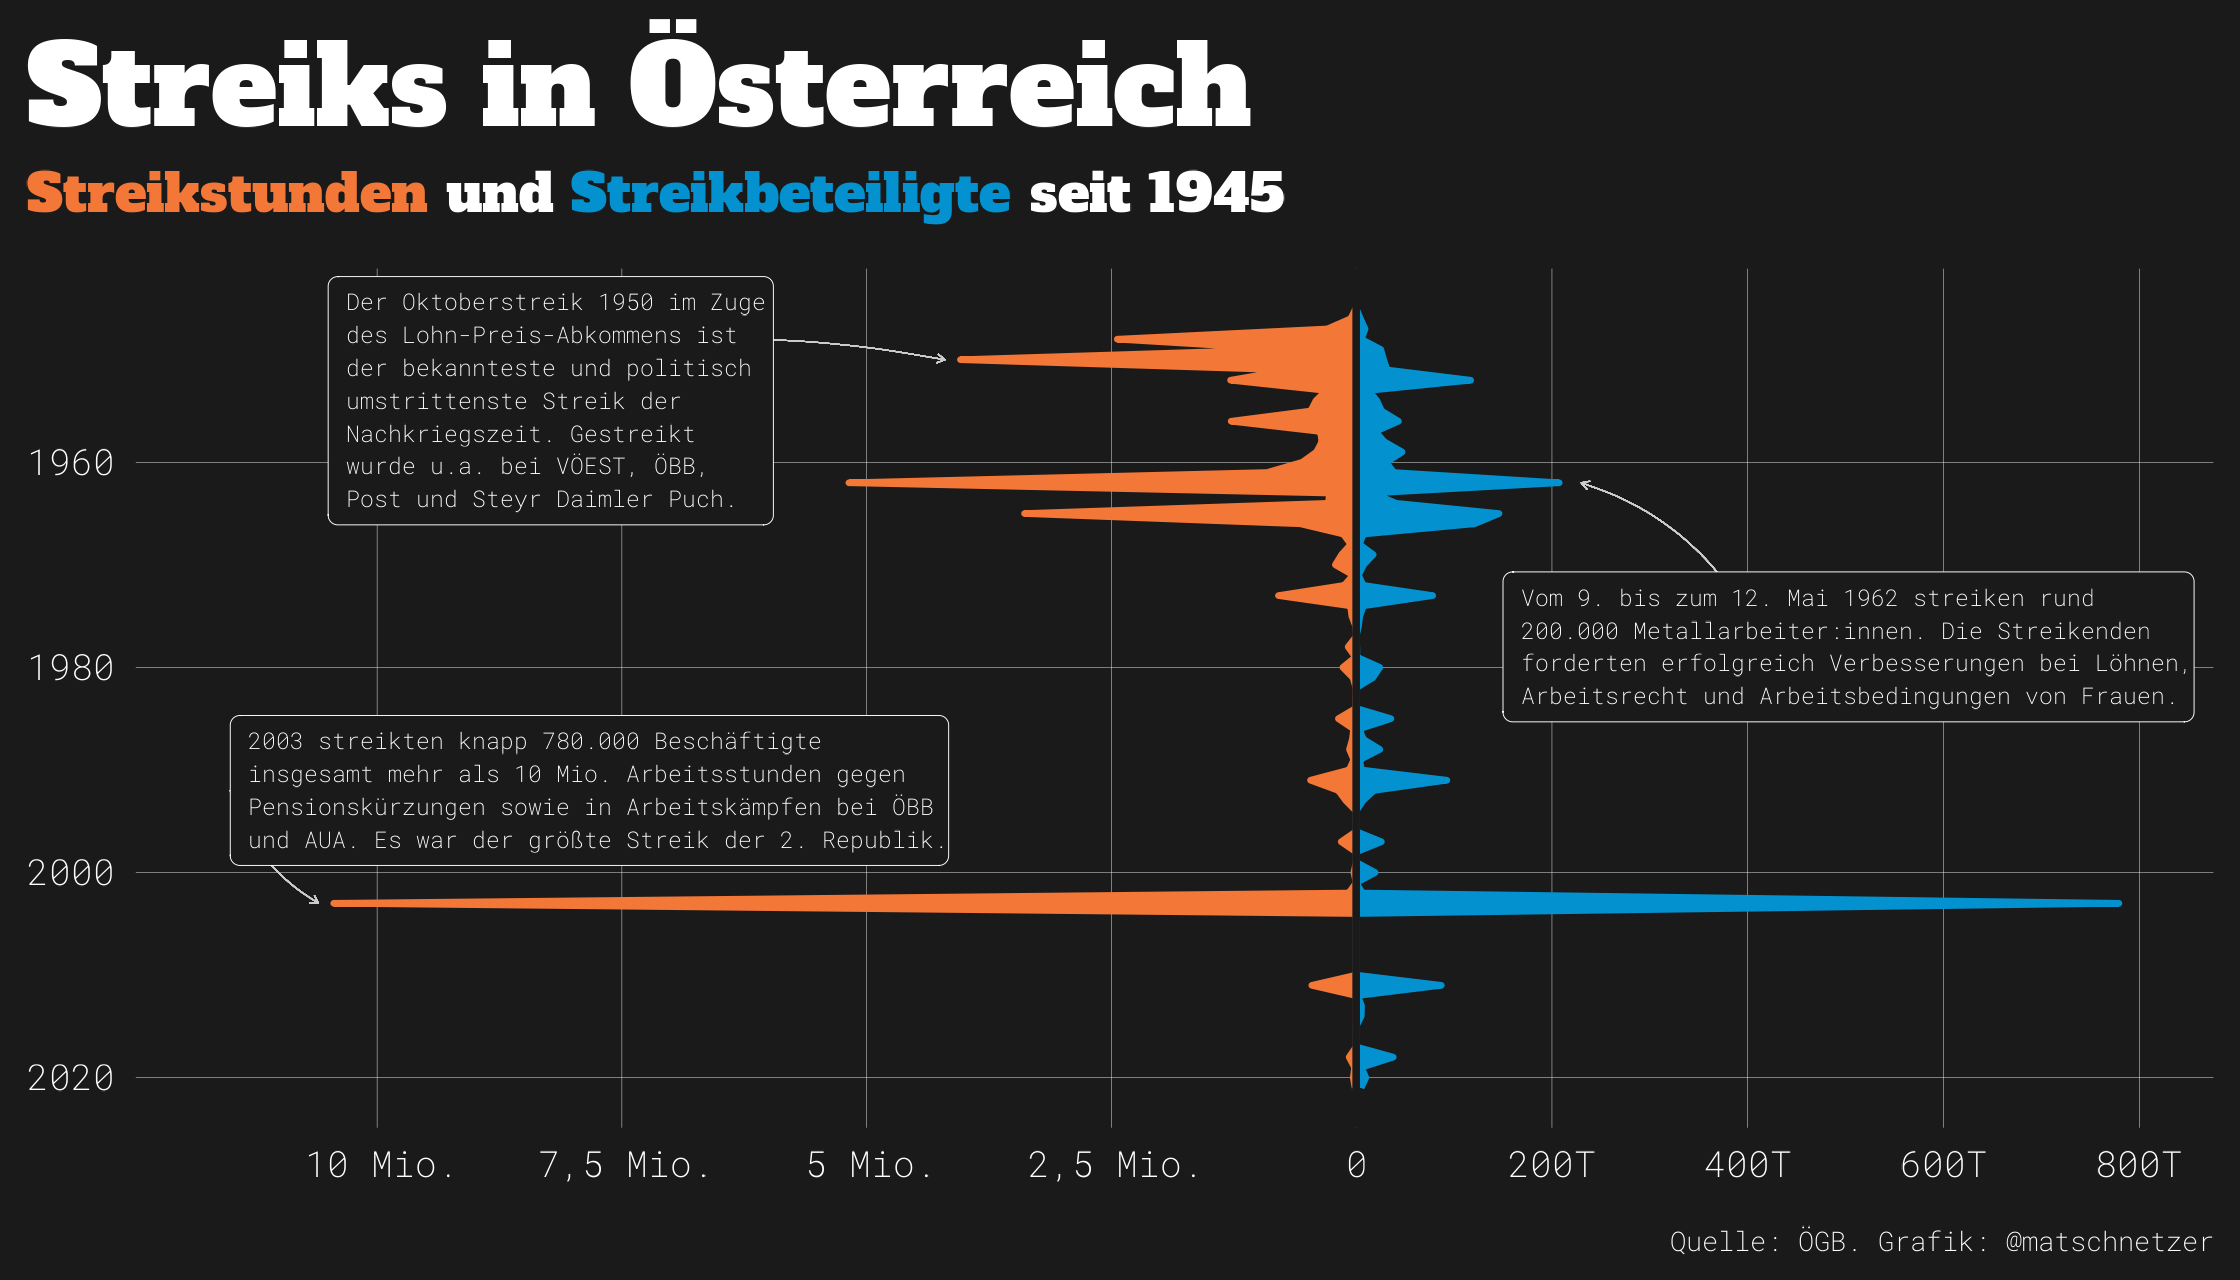
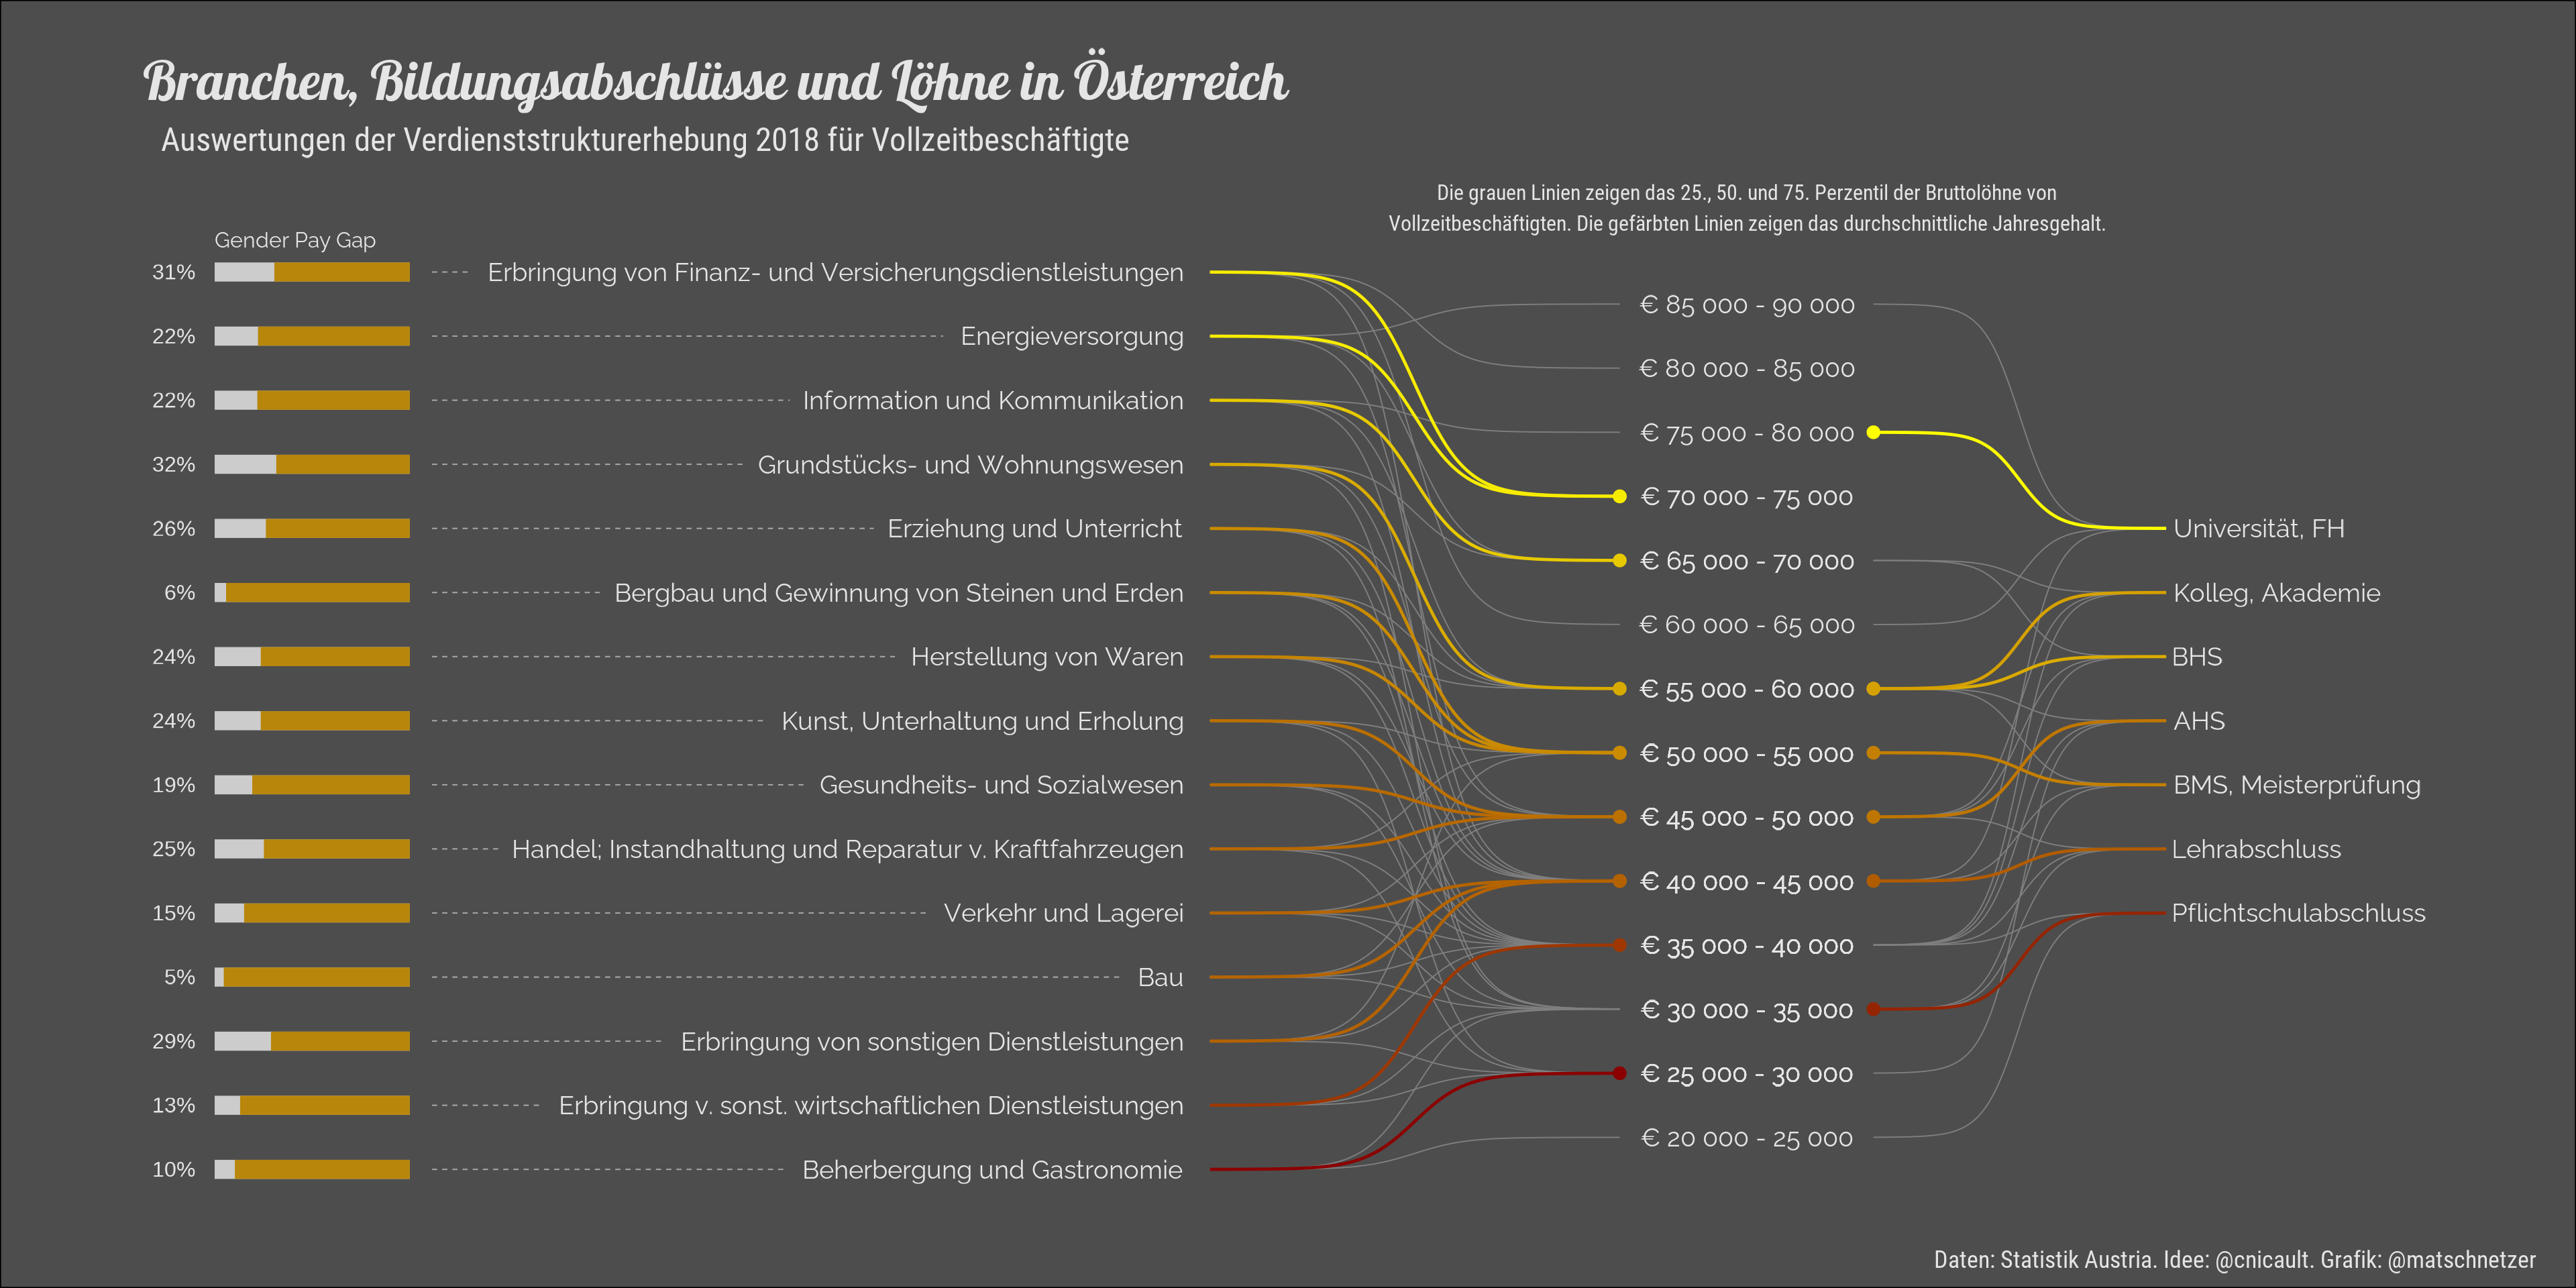
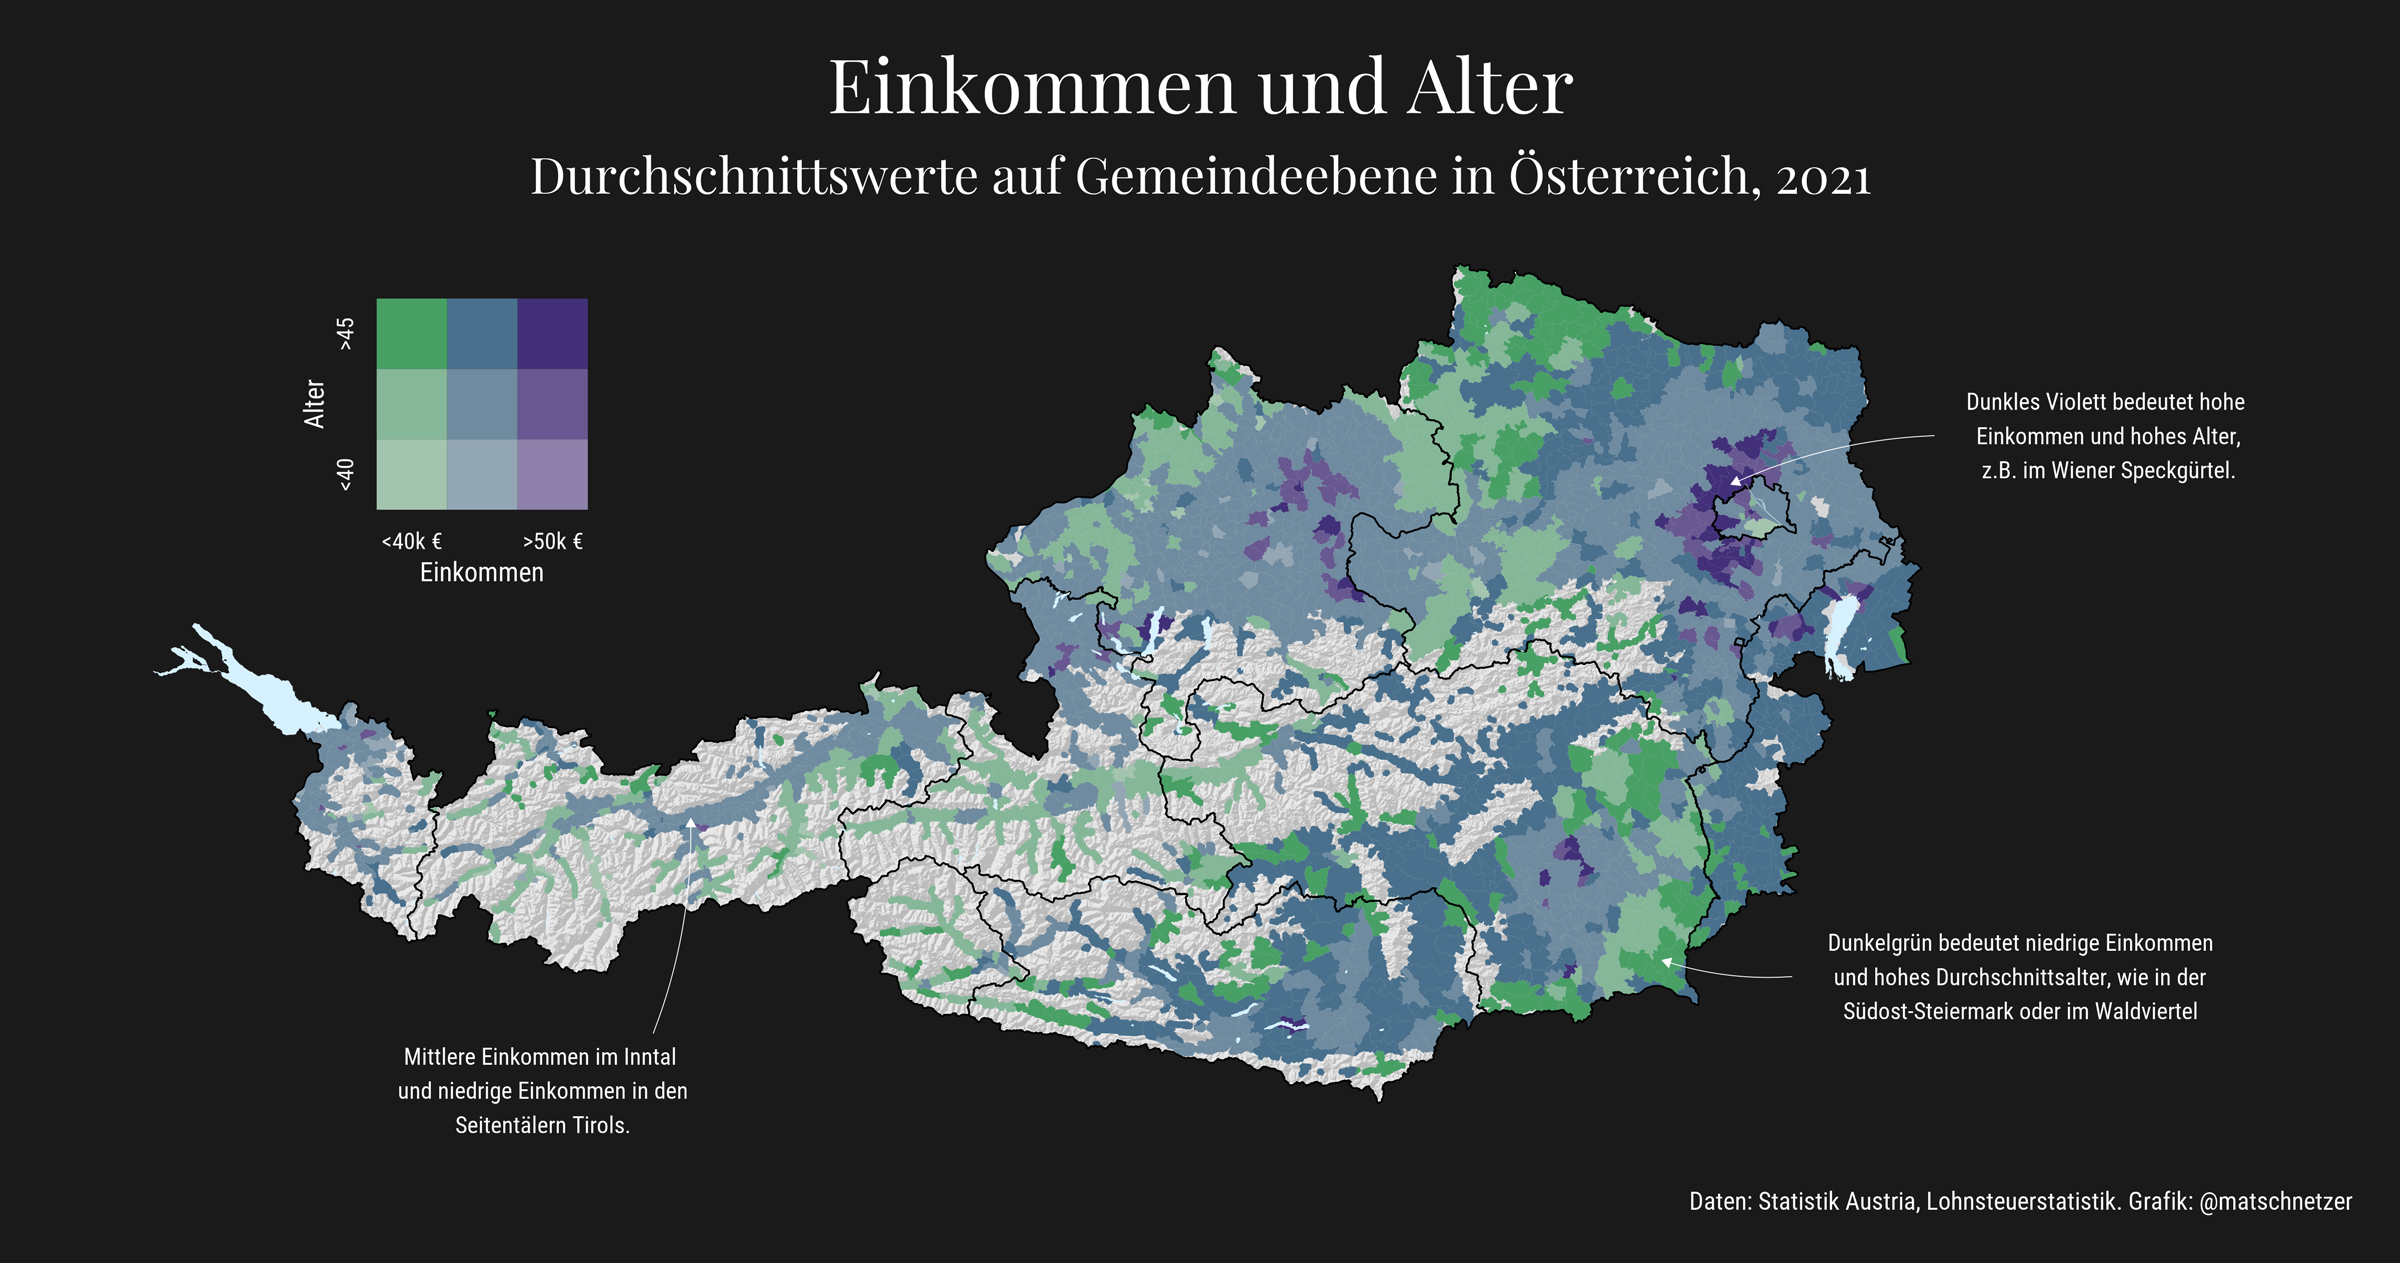
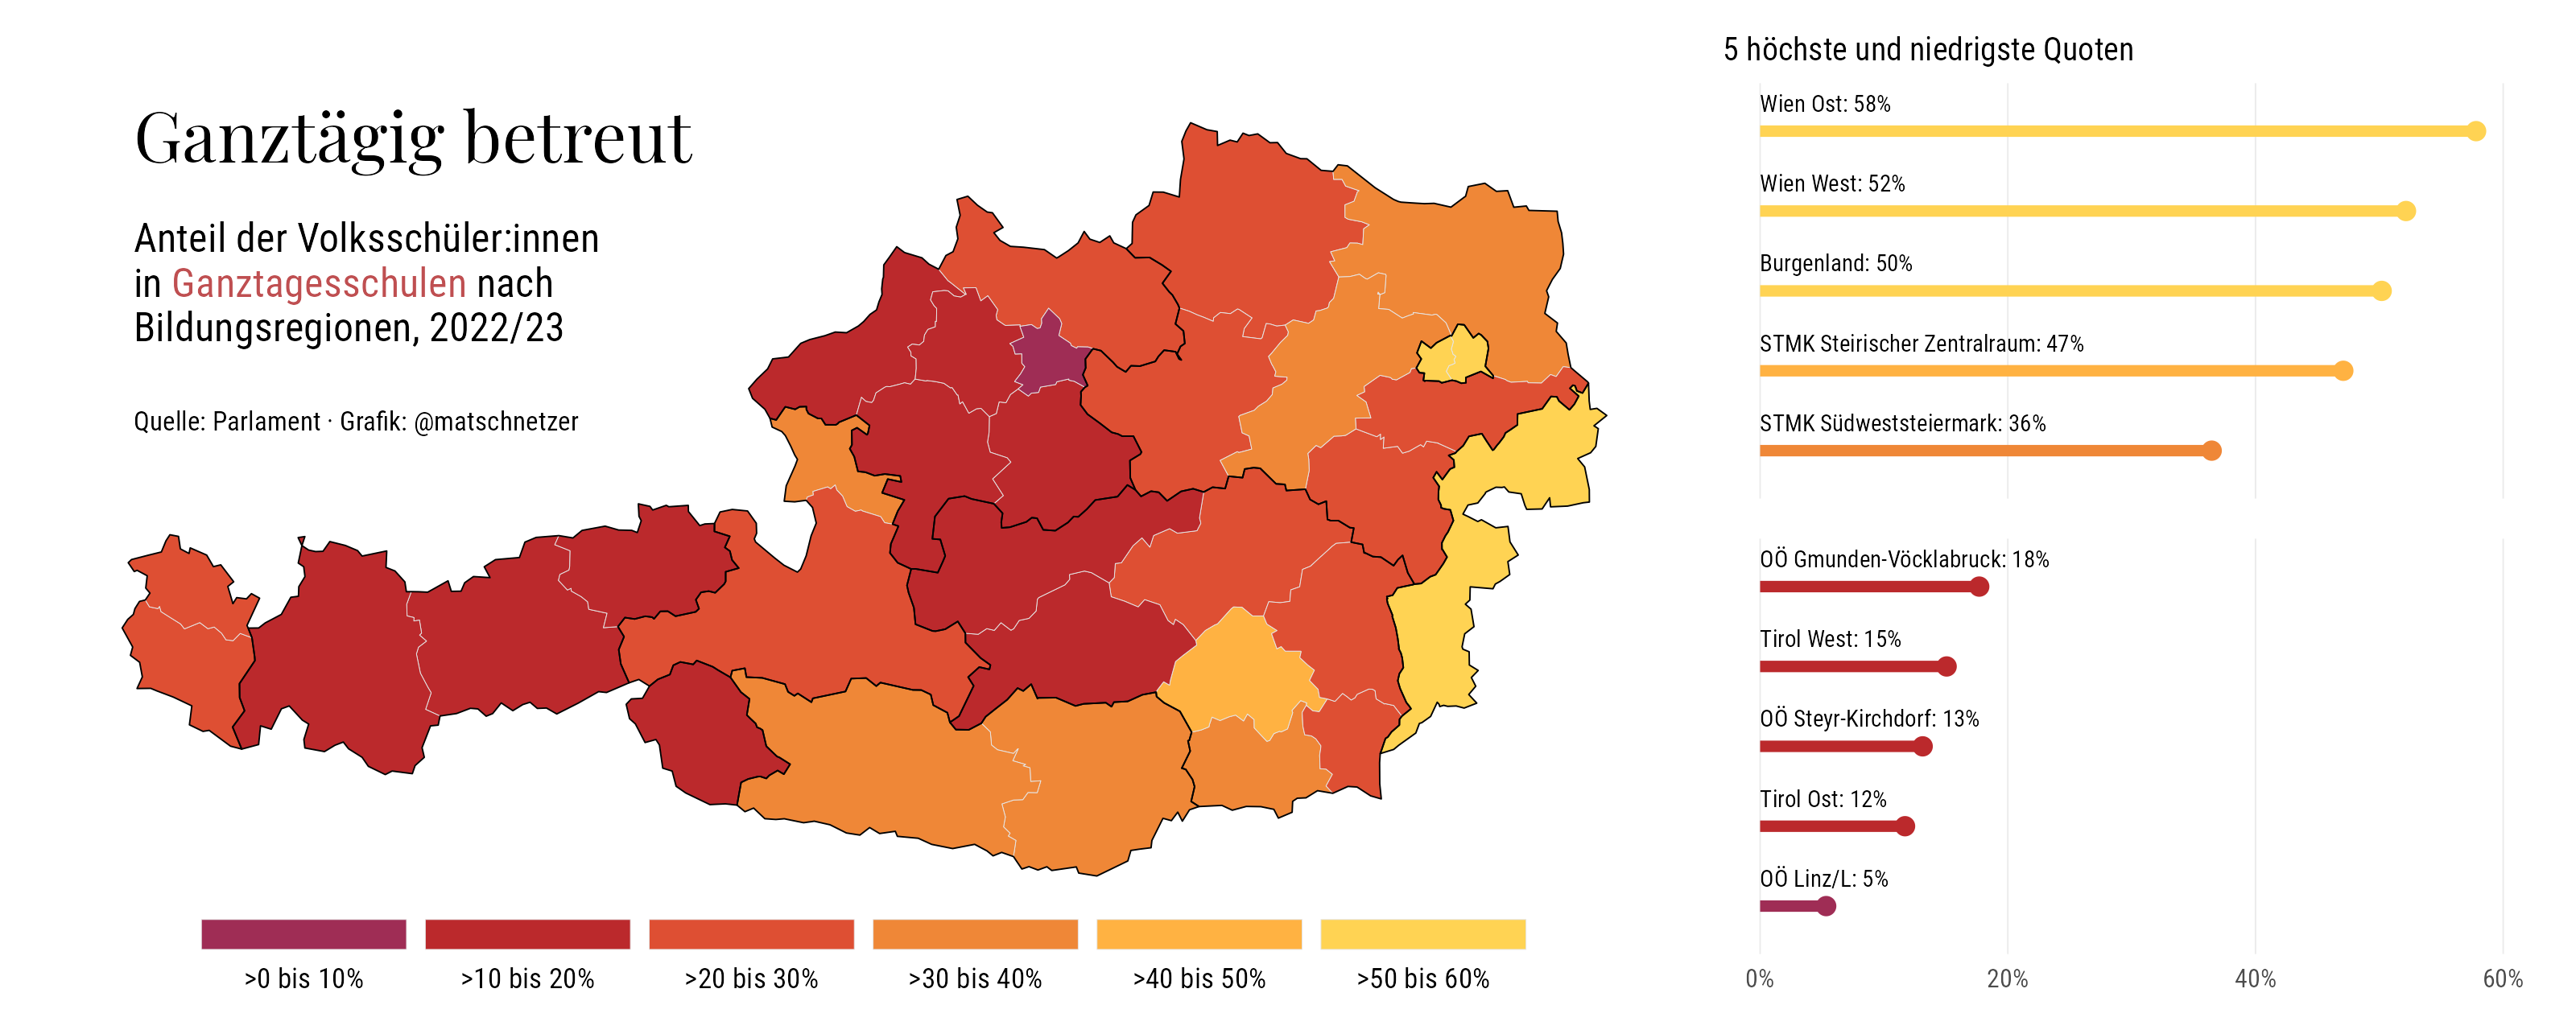
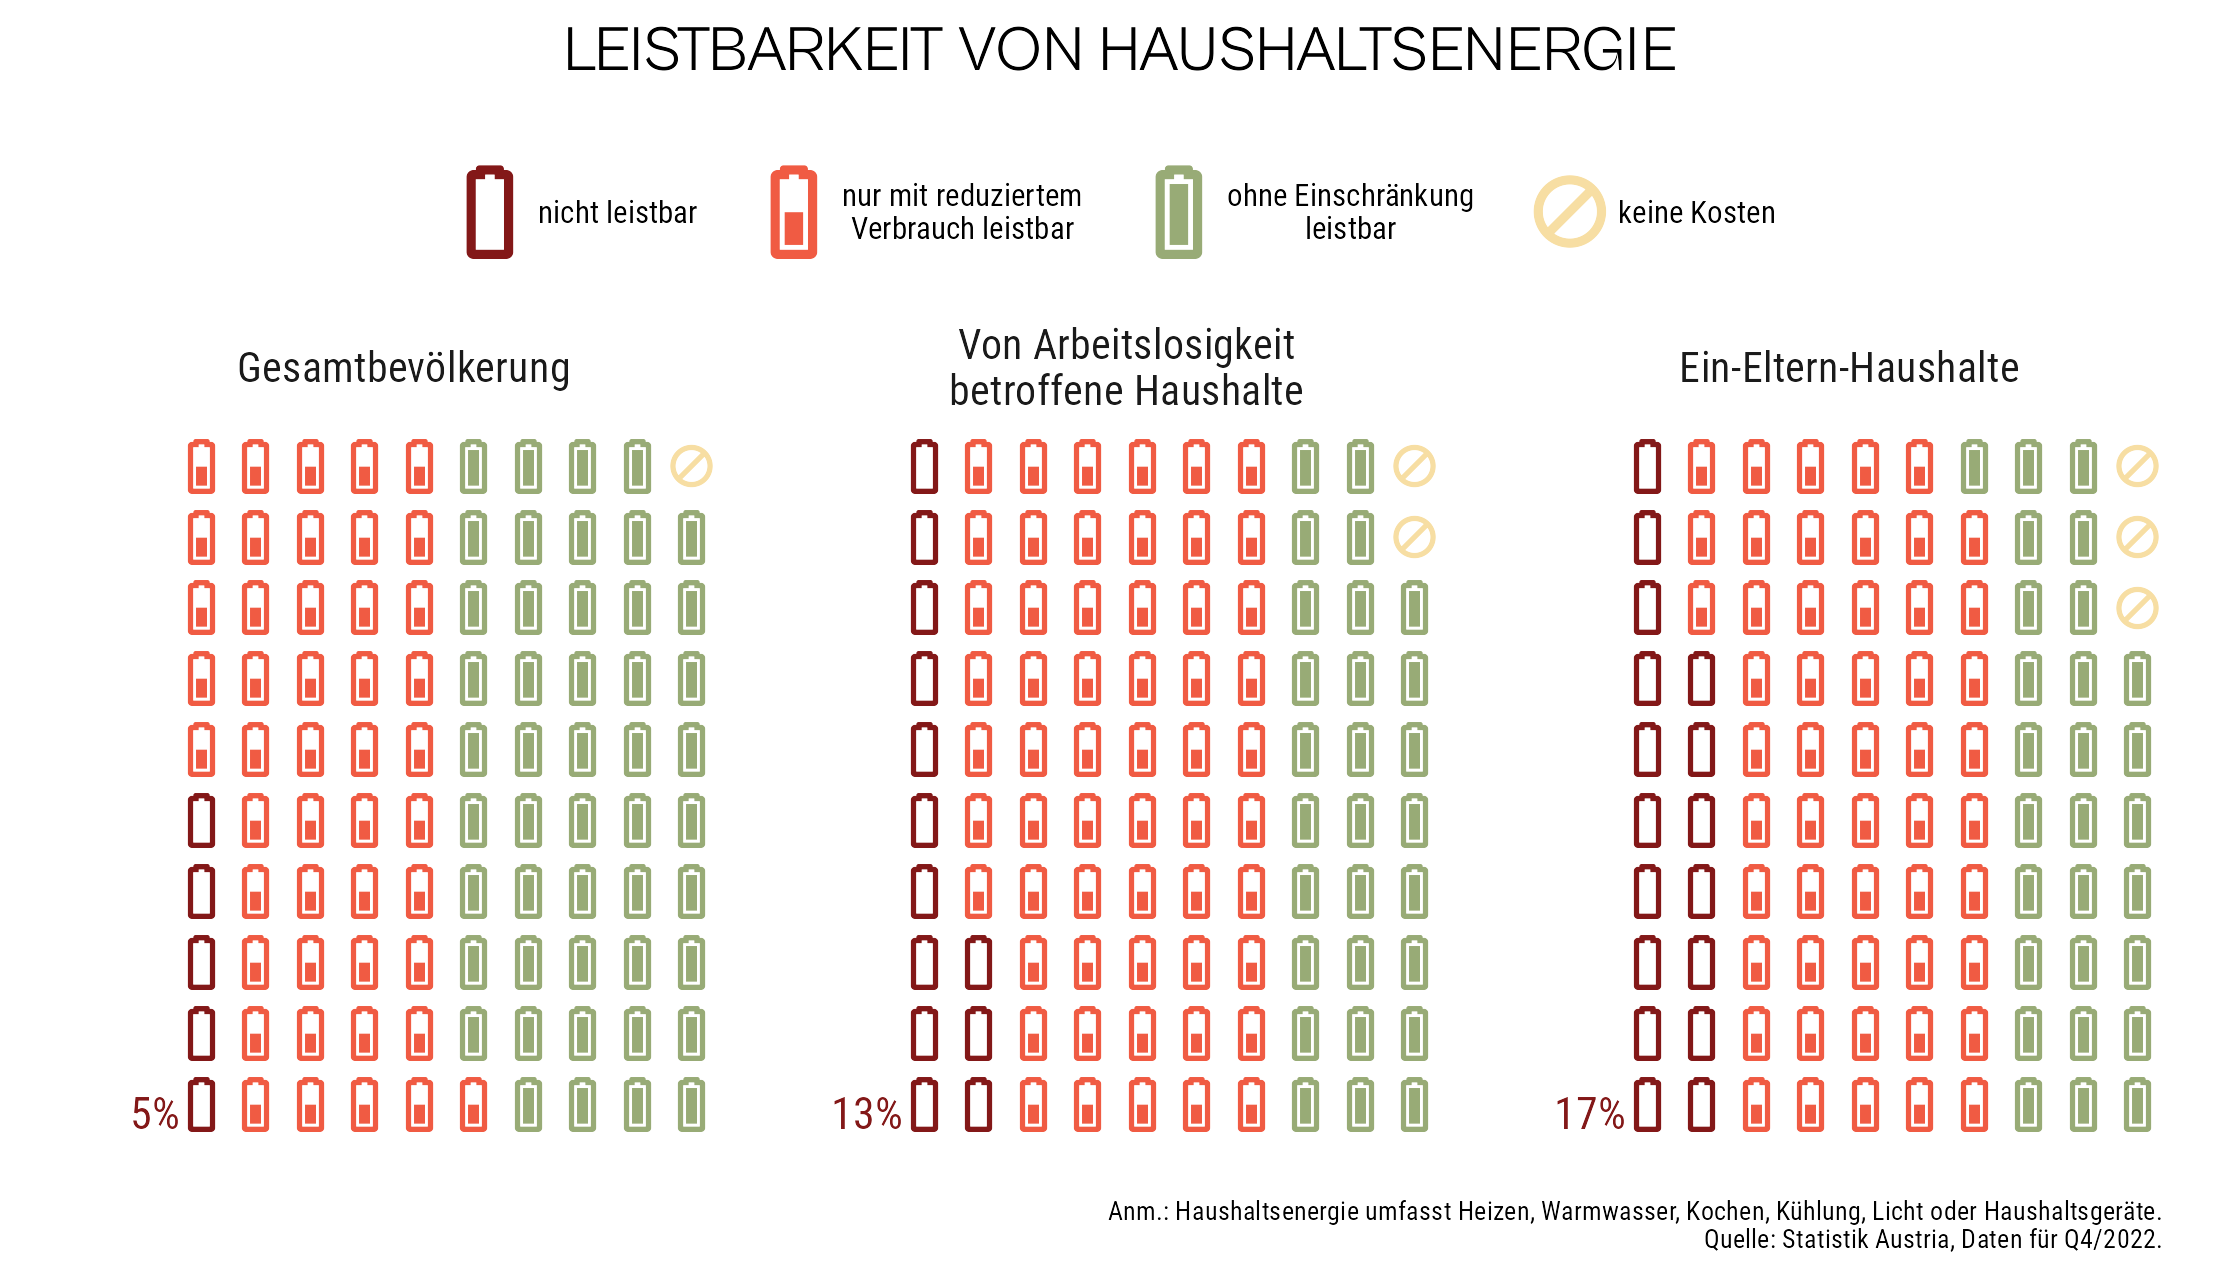
These are some of my favorite visualizations. Click to enlarge the images and feel free to share them with your friends. Please reach out if you have any questions.


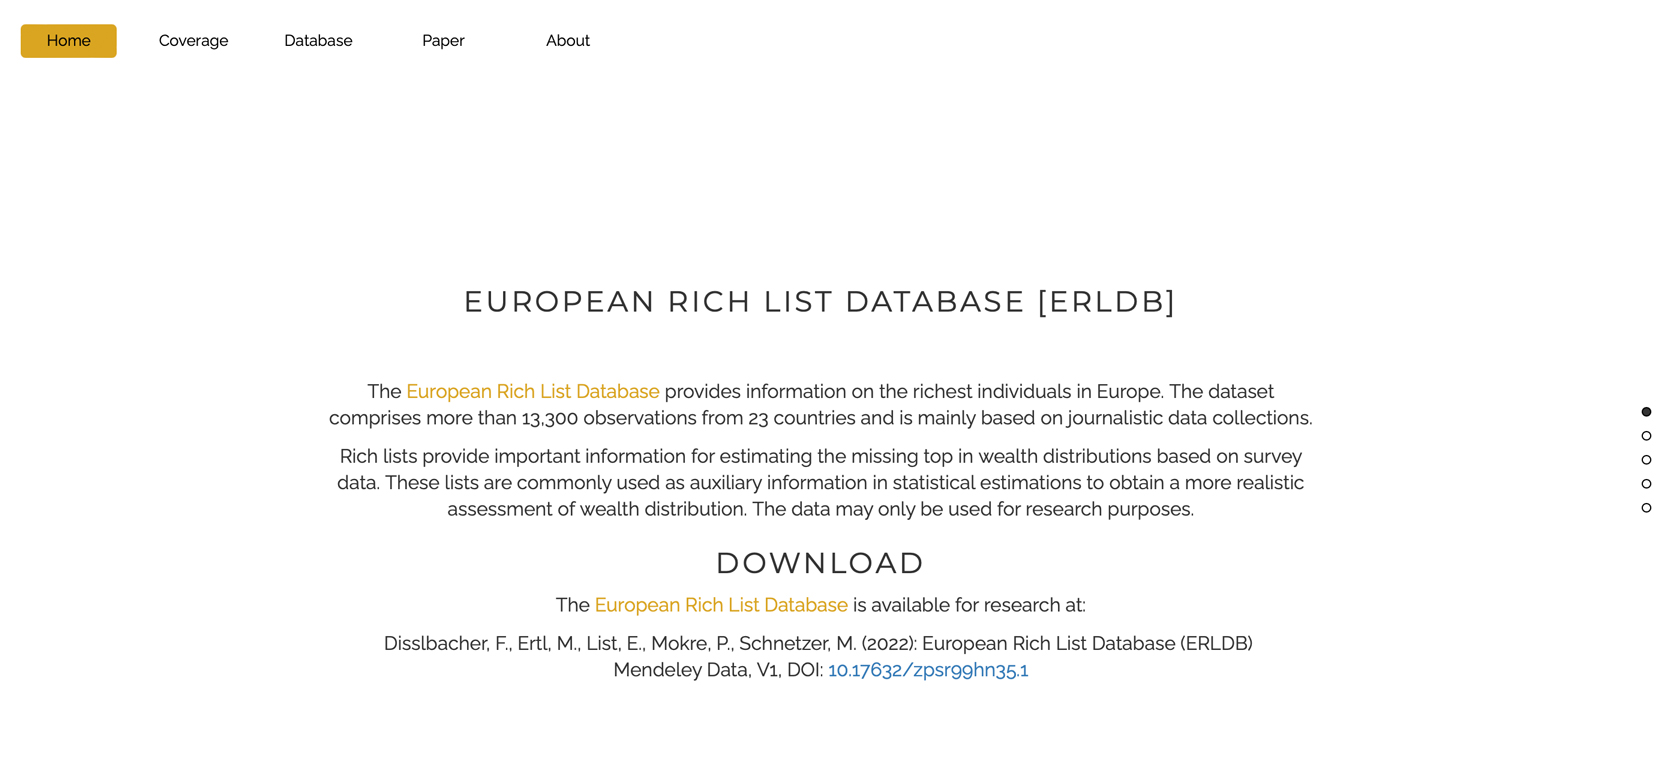
Webdesign
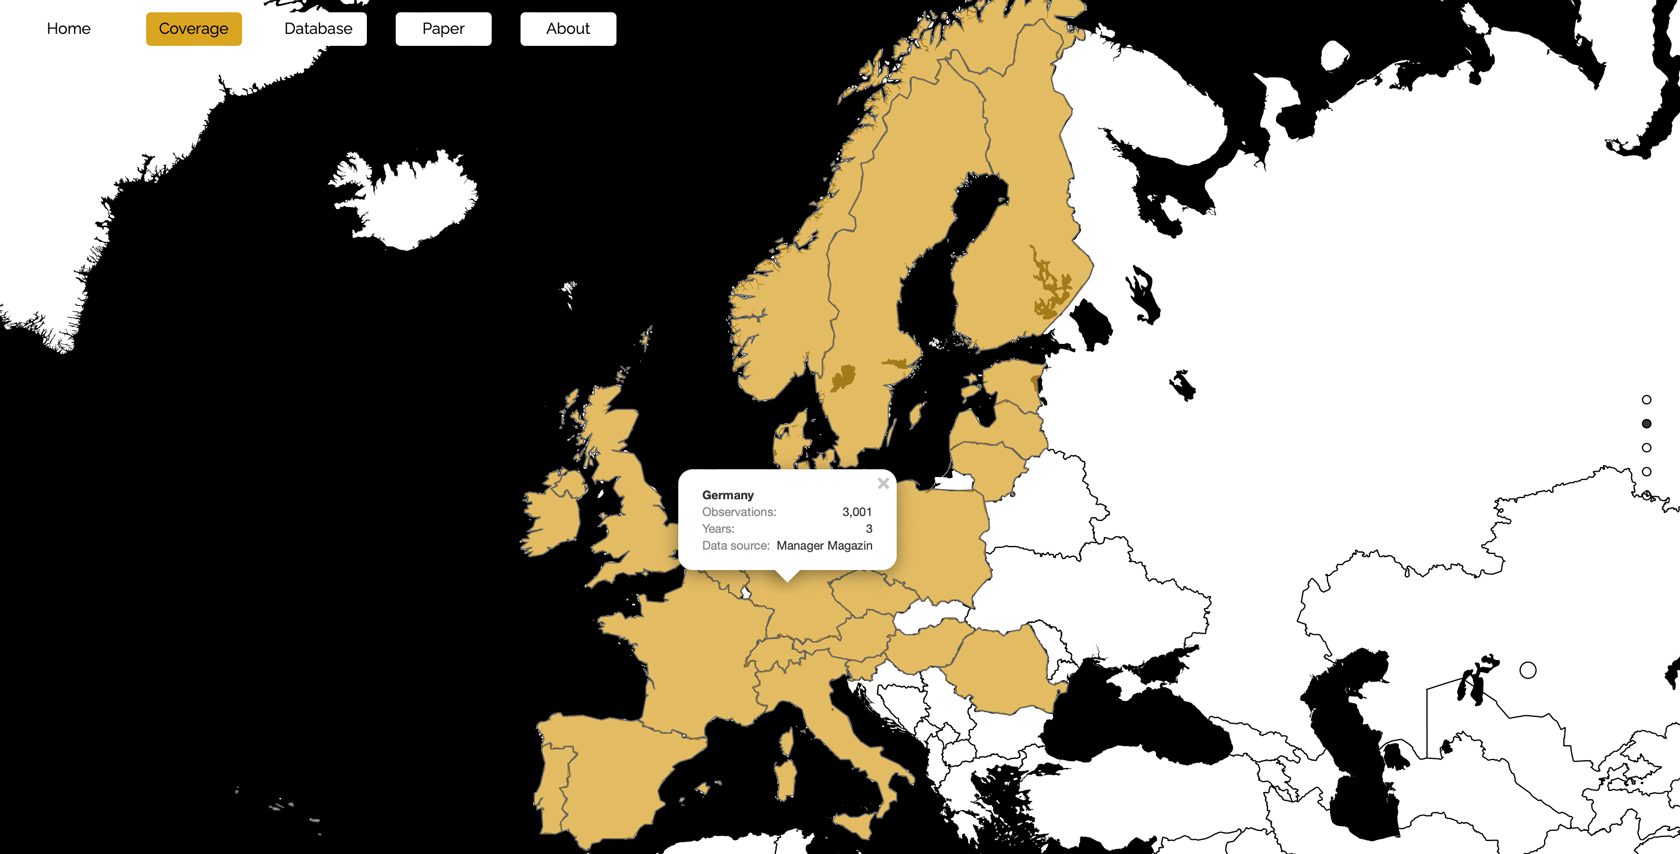
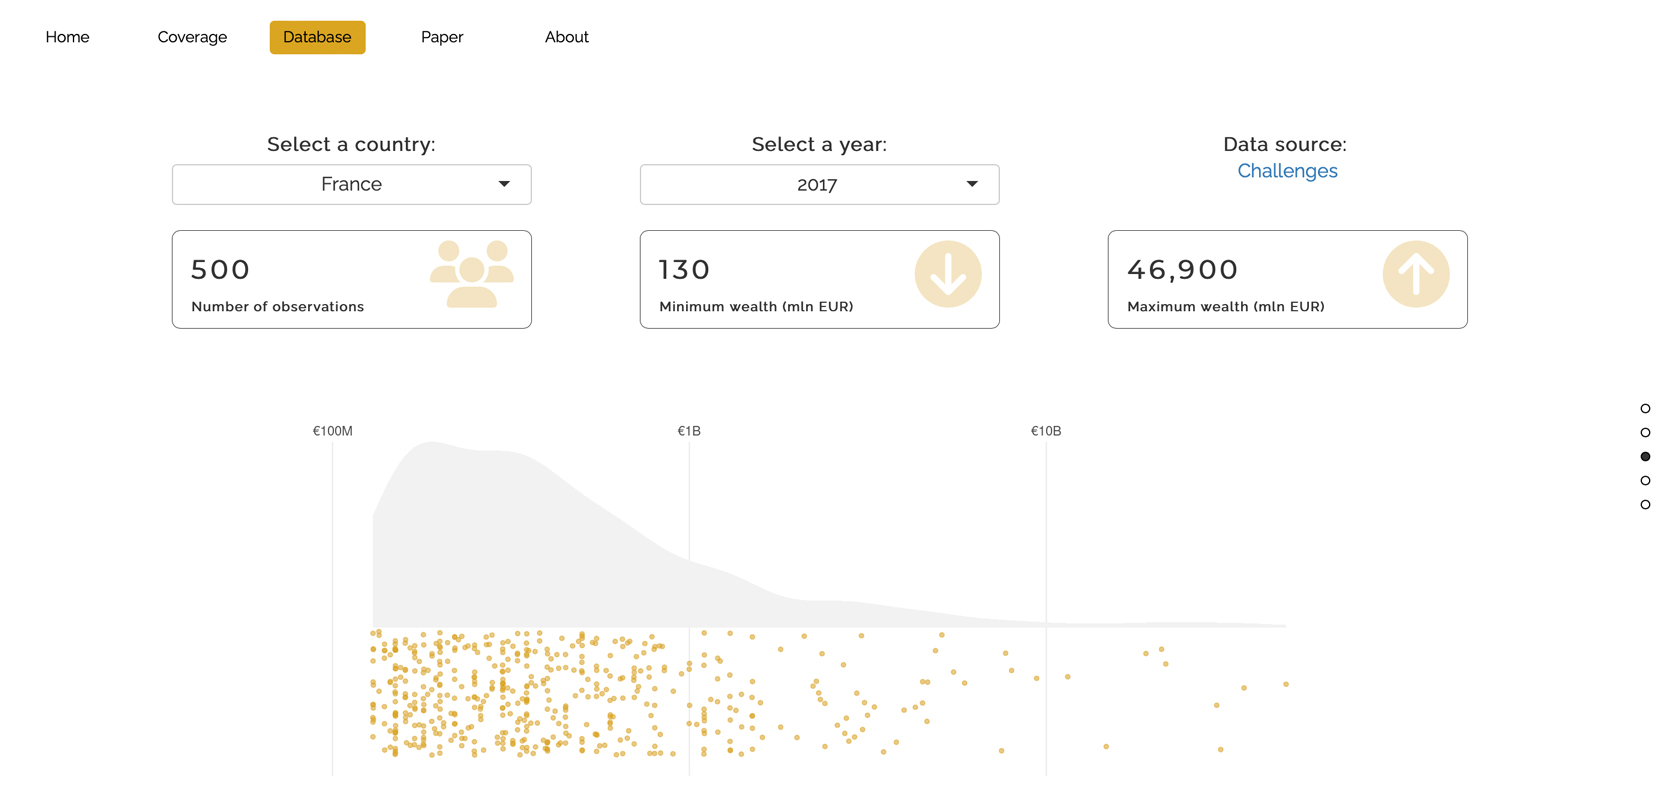
For a research project, I designed an online database with Shiny for R. The European Rich List Database (ERLDB) provides more than 13,300 observations of the richest families across Europe.
ERLDB
Contact
Do not hesitate to reach out and drop me a message. I am always keen to improve my plotting skills and grateful for any suggestions and advice.