The economics of inequality

Recent research on wealth inequality

Dr. Matthias Schnetzer

November 11, 2022

Recap

  • Which trend can you identify for the wage share in most European countries and why is that?
  • What are Kuznets Waves?
  • What does the elephant curve by Branko Milanovic show?
  • What are malign and benign factors that might lead to a decrease in global inequality?

What is wealth and how do we measure it?

Definition of private wealth

Non-financial assets

  • Dwellings (owner-occupied residence, other real estate)
  • Consumer durables (vehicles, etc.)
  • Valuables
  • Intellectual property

Financial assets

  • Currency and deposits
  • Net equity in own unincorporated business
  • Mututal funds and investment funds
  • (Private) Pensions funds
  • Bonds and other debt securities
  • Shares and other equity
  • Life insurance funds -Other financial assets

Liabilities

  • Owner-occupied residence loans
  • Consumer durable loans (e.g. for vehicles)
  • Other investment loans (collateralized)
  • Other loans (e.g. education loans)

No human, social and cultural capital; No public social security pensions (marketable vs. augmented wealth)

HFCS versus National Accounts

Underreporting in HFCS in % of NA Tangible assets Financial wealth Liabilities Net wealth
Austria -8 62 59 12
Germany 15 58 29 30
France 17 61 33 32
Spain 16 63 39 24
Italy -5 80 60 23
Belgium -21 42 24 6
Finland -1 63 12 22
Netherlands 13 86 16 47

Why is there underreporting in HFCS?

  • Target population in Austria: 3.9 million households
  • Gross sample in HFCS 2017: 6,280 households
  • Realized interviews: 3,072 households
  • Response rate in HFCS 2017: approx. 50%
  • Residual: refused interviews, invalid addresses, households not available, etc.
  • Response refusal correlates with wealth and is highest at the top (Vermeulen, 2016)
  • Wealthy households own a greater number of assets and miss some components more easily (Kennickell/Woodburn, 1999)

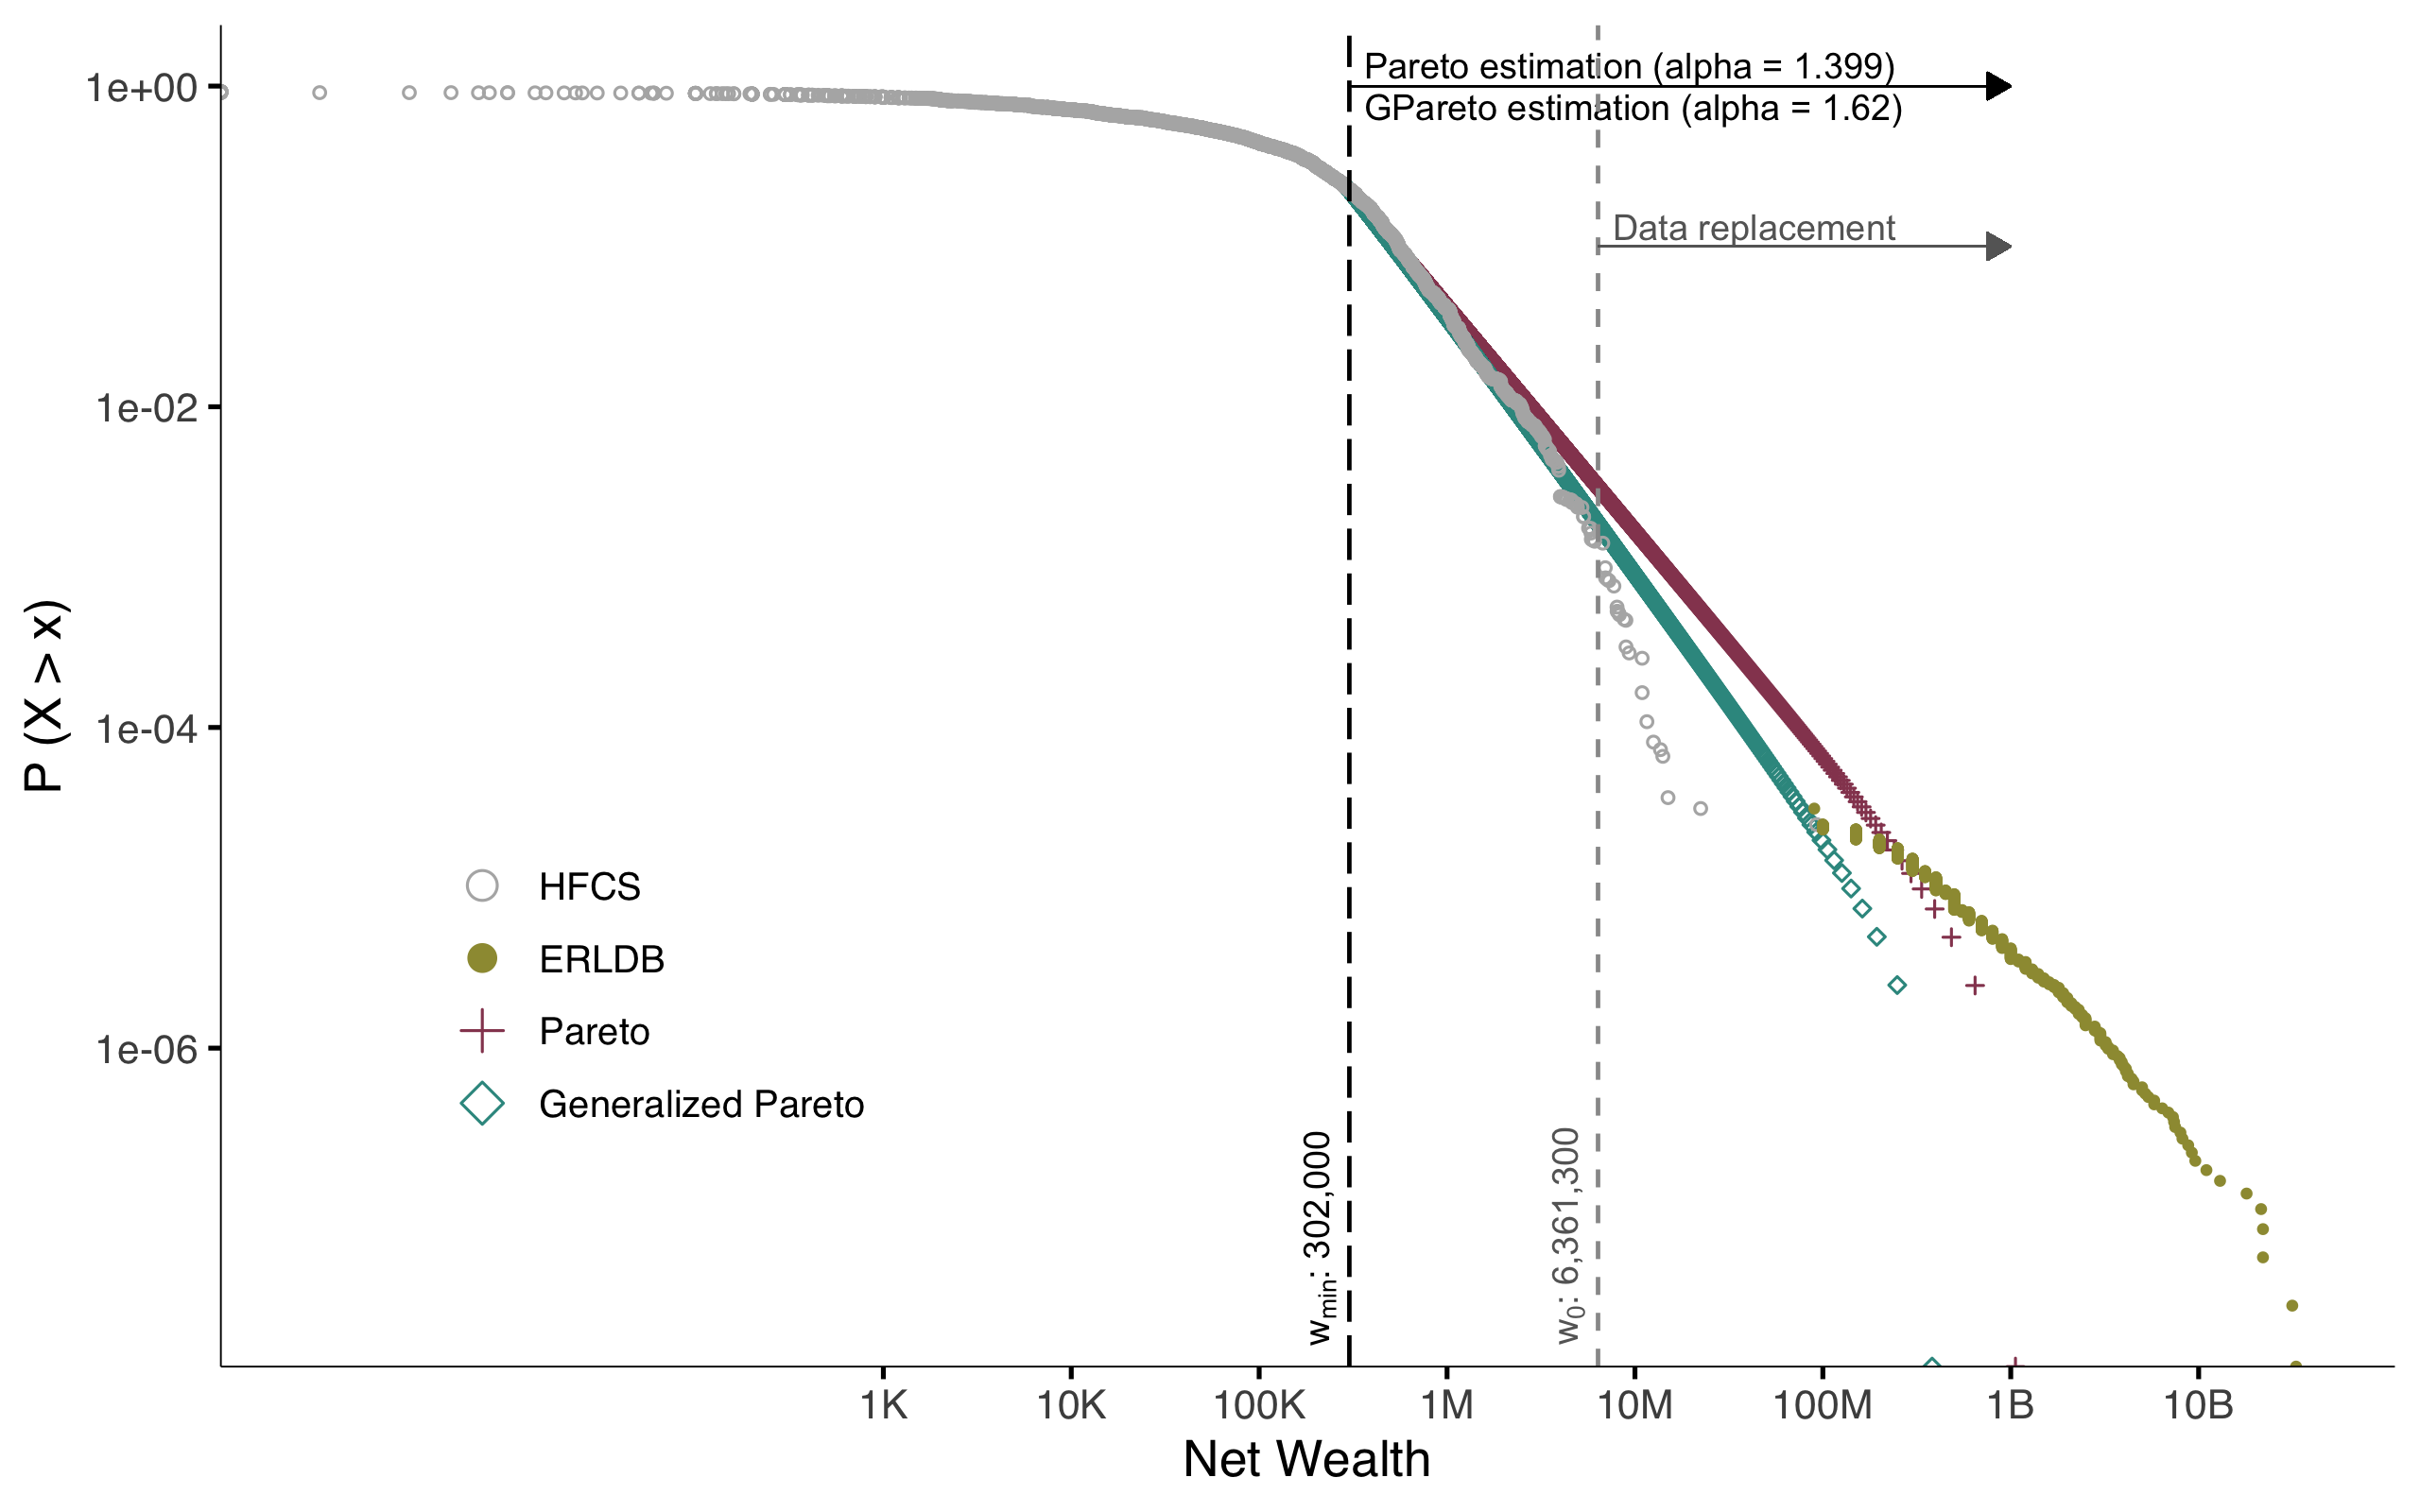
How to deal with the missing top in wealth surveys?

Upstream strategy: Oversampling

  • Undercoverage and Underreporting
  • Oversampling is crucial for wealth surveys
  • Oversampling in HFCS 2017: ๐Ÿ‡ง๐Ÿ‡ช ๐Ÿ‡จ๐Ÿ‡พ ๐Ÿ‡ฉ๐Ÿ‡ช ๐Ÿ‡ช๐Ÿ‡ช ๐Ÿ‡ช๐Ÿ‡ธ ๐Ÿ‡ซ๐Ÿ‡ฎ ๐Ÿ‡ซ๐Ÿ‡ท ๐Ÿ‡ฌ๐Ÿ‡ท ๐Ÿ‡ญ๐Ÿ‡ท ๐Ÿ‡ญ๐Ÿ‡บ ๐Ÿ‡ฎ๐Ÿ‡ช ๐Ÿ‡ฑ๐Ÿ‡ป ๐Ÿ‡ฑ๐Ÿ‡น ๐Ÿ‡ฑ๐Ÿ‡บ ๐Ÿ‡ต๐Ÿ‡ฑ ๐Ÿ‡ต๐Ÿ‡น ๐Ÿ‡ธ๐Ÿ‡ฐ
  • No oversampling: ๐Ÿ‡ฆ๐Ÿ‡น ๐Ÿ‡ฎ๐Ÿ‡น ๐Ÿ‡ฒ๐Ÿ‡น ๐Ÿ‡ณ๐Ÿ‡ฑ ๐Ÿ‡ธ๐Ÿ‡ฎ
  • How does oversampling work?
    • External personal wealth data (๐Ÿ‡ซ๐Ÿ‡ท ๐Ÿ‡ช๐Ÿ‡ธ)
    • List of streets with high-income people (๐Ÿ‡ฉ๐Ÿ‡ช ๐Ÿ‡ธ๐Ÿ‡ฐ)
    • Income tax data (๐Ÿ‡ฑ๐Ÿ‡บ 20% of the sample from top 10% earners)
    • Regions with higher average income (๐Ÿ‡ต๐Ÿ‡ฑ)

Downstream strategy: Pareto estimation

  • Pareto-Distribution is a sensible approximation to the distribution of large wealth
  • Two parameters:
    • Threshold for โ€œlargeโ€ wealth \(m\)
    • Pareto-Index \(\alpha\)

\[P_i(x_i) = Pr(X_i \leqslant x_i) = 1 - \left(\frac{m_i}{x_i}\right)^{\alpha_i}\] \[\forall ~\text{implicates} ~i = 1...5 \wedge x_i \geqslant m_i\]

A smaller \(\alpha\) means greater inequality. Empirically, \(\alpha\) often is around 1.5 for wealth.

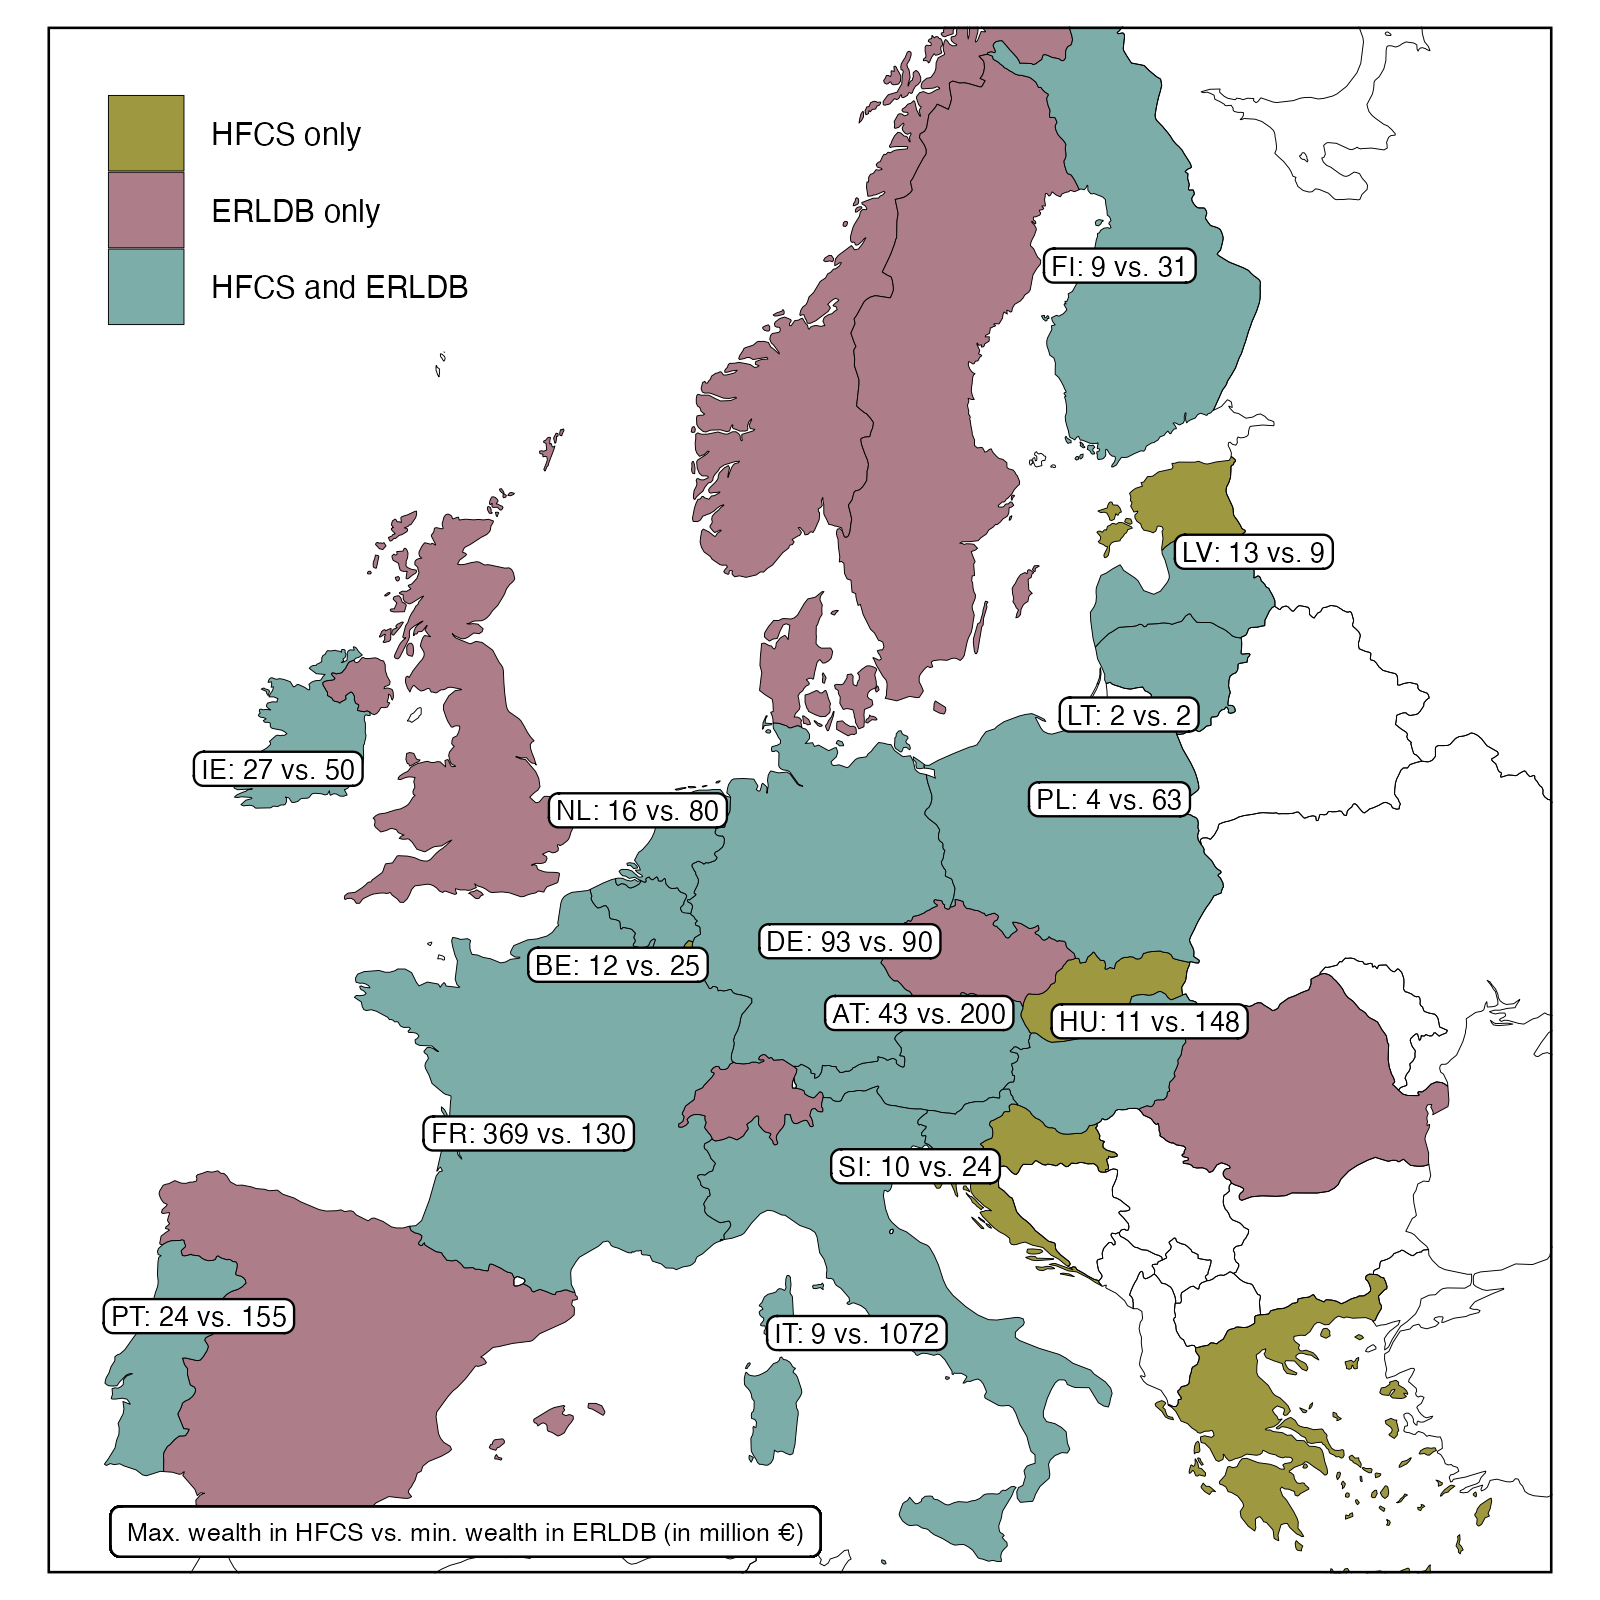
European Rich List Database (ERLDB) and HFCS

Cumulative density function of wealth in Germany

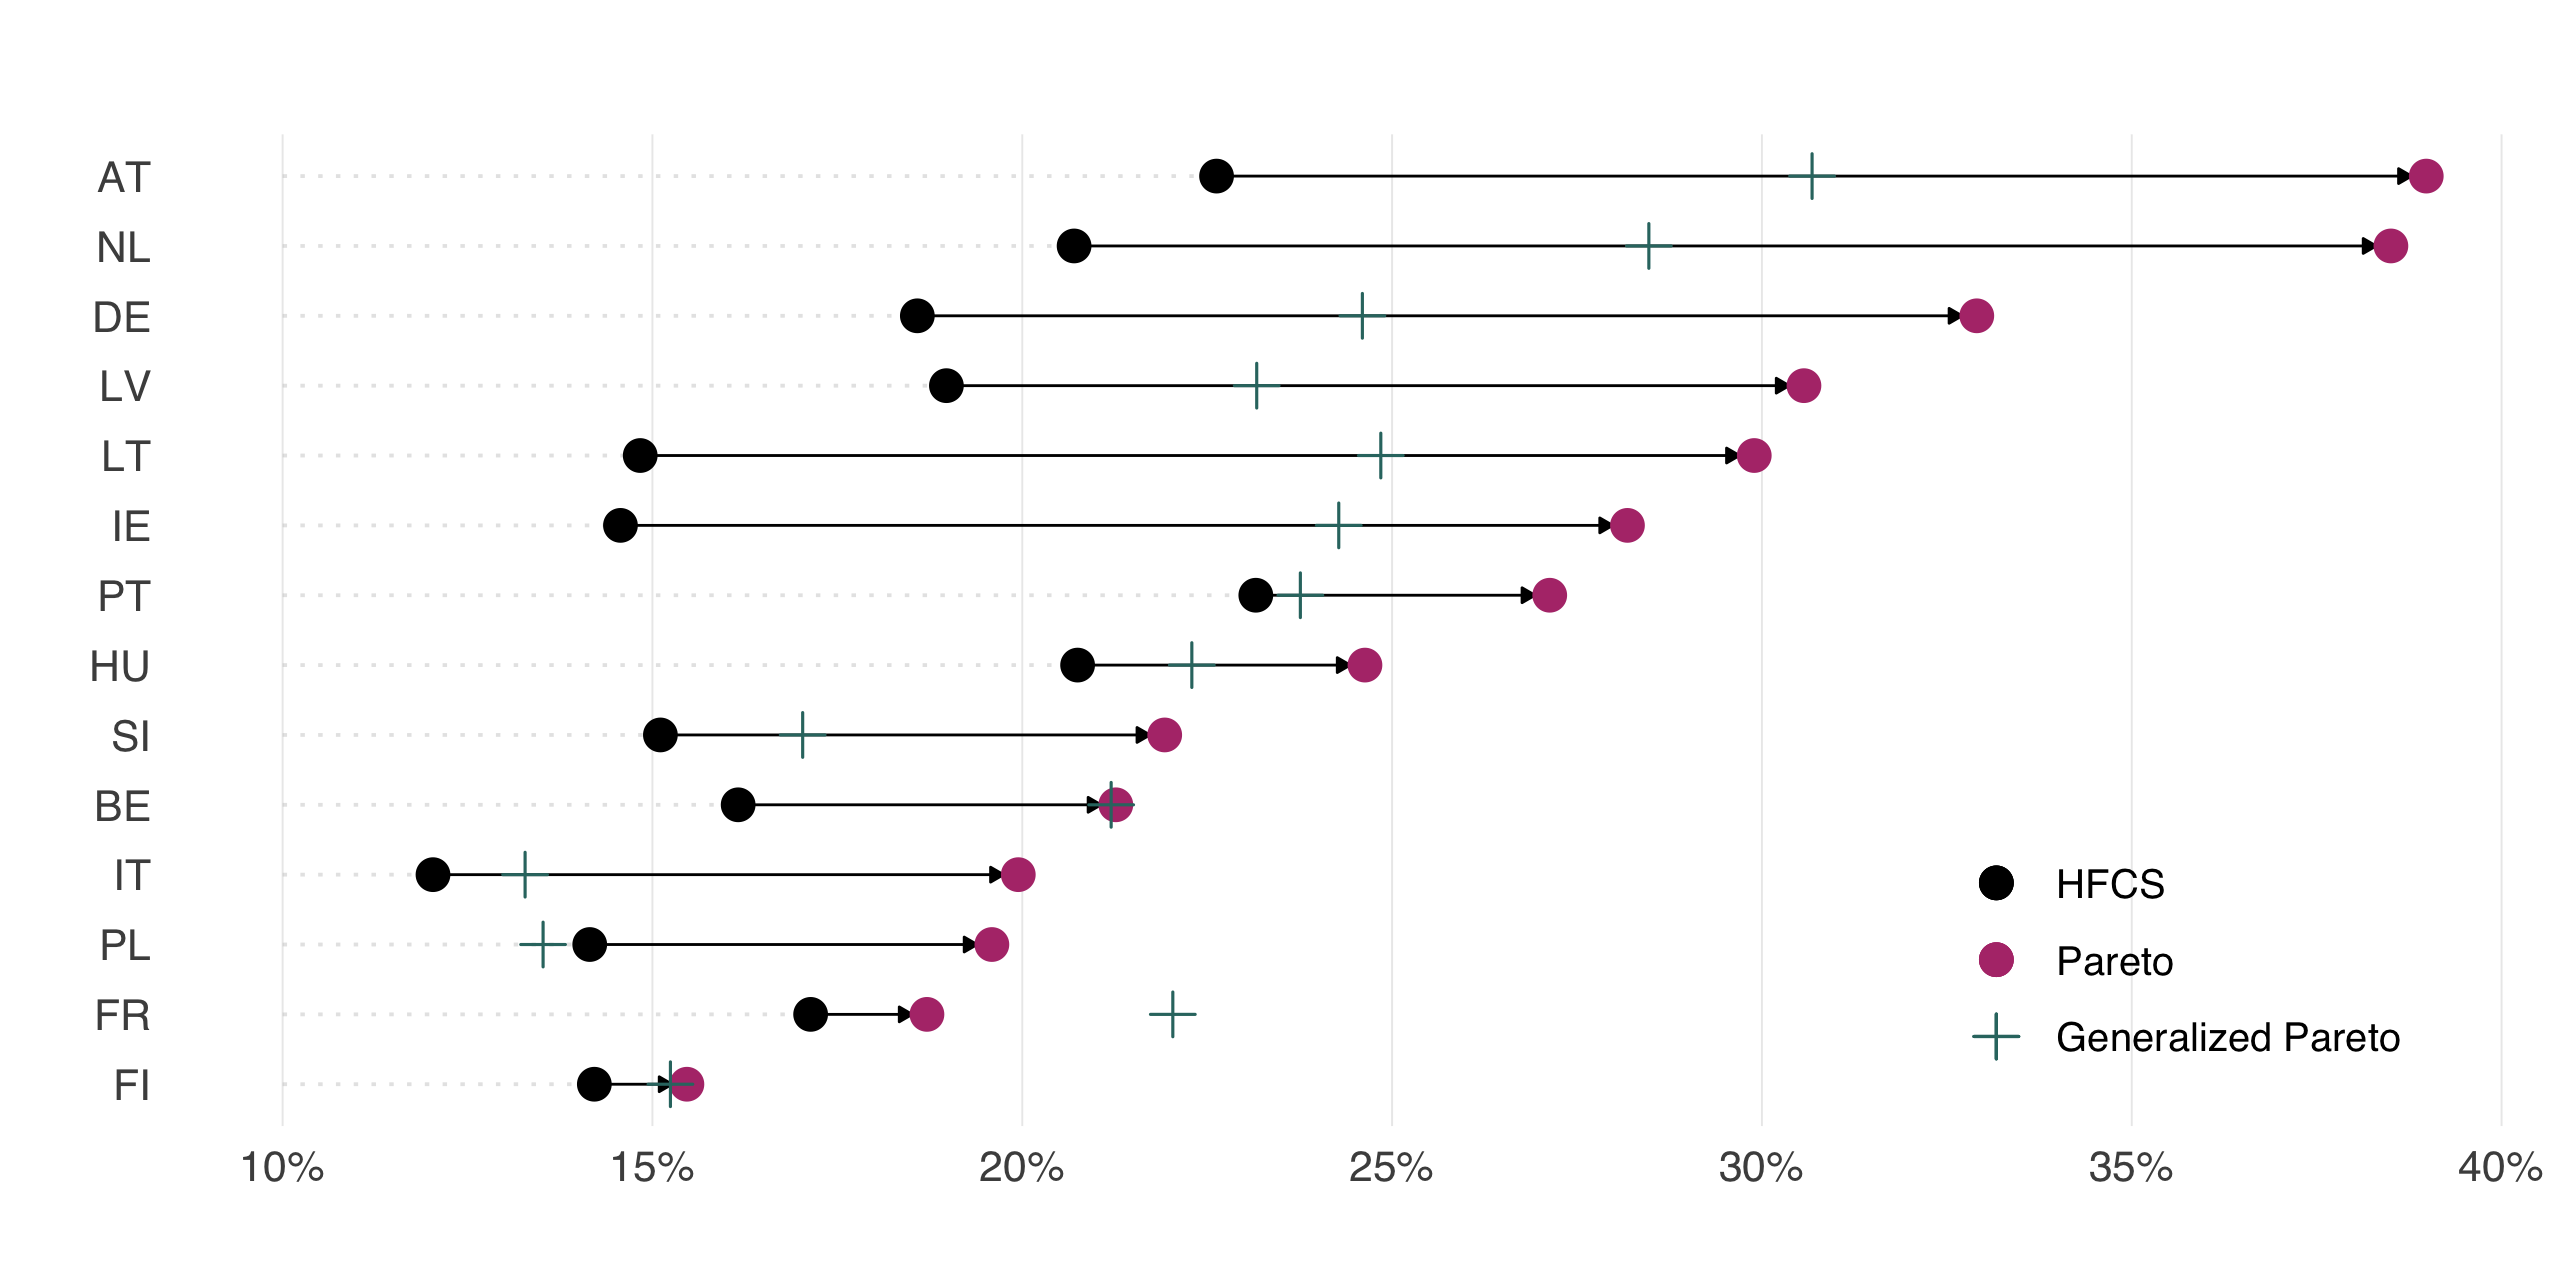
Adjustment of top 1% shares

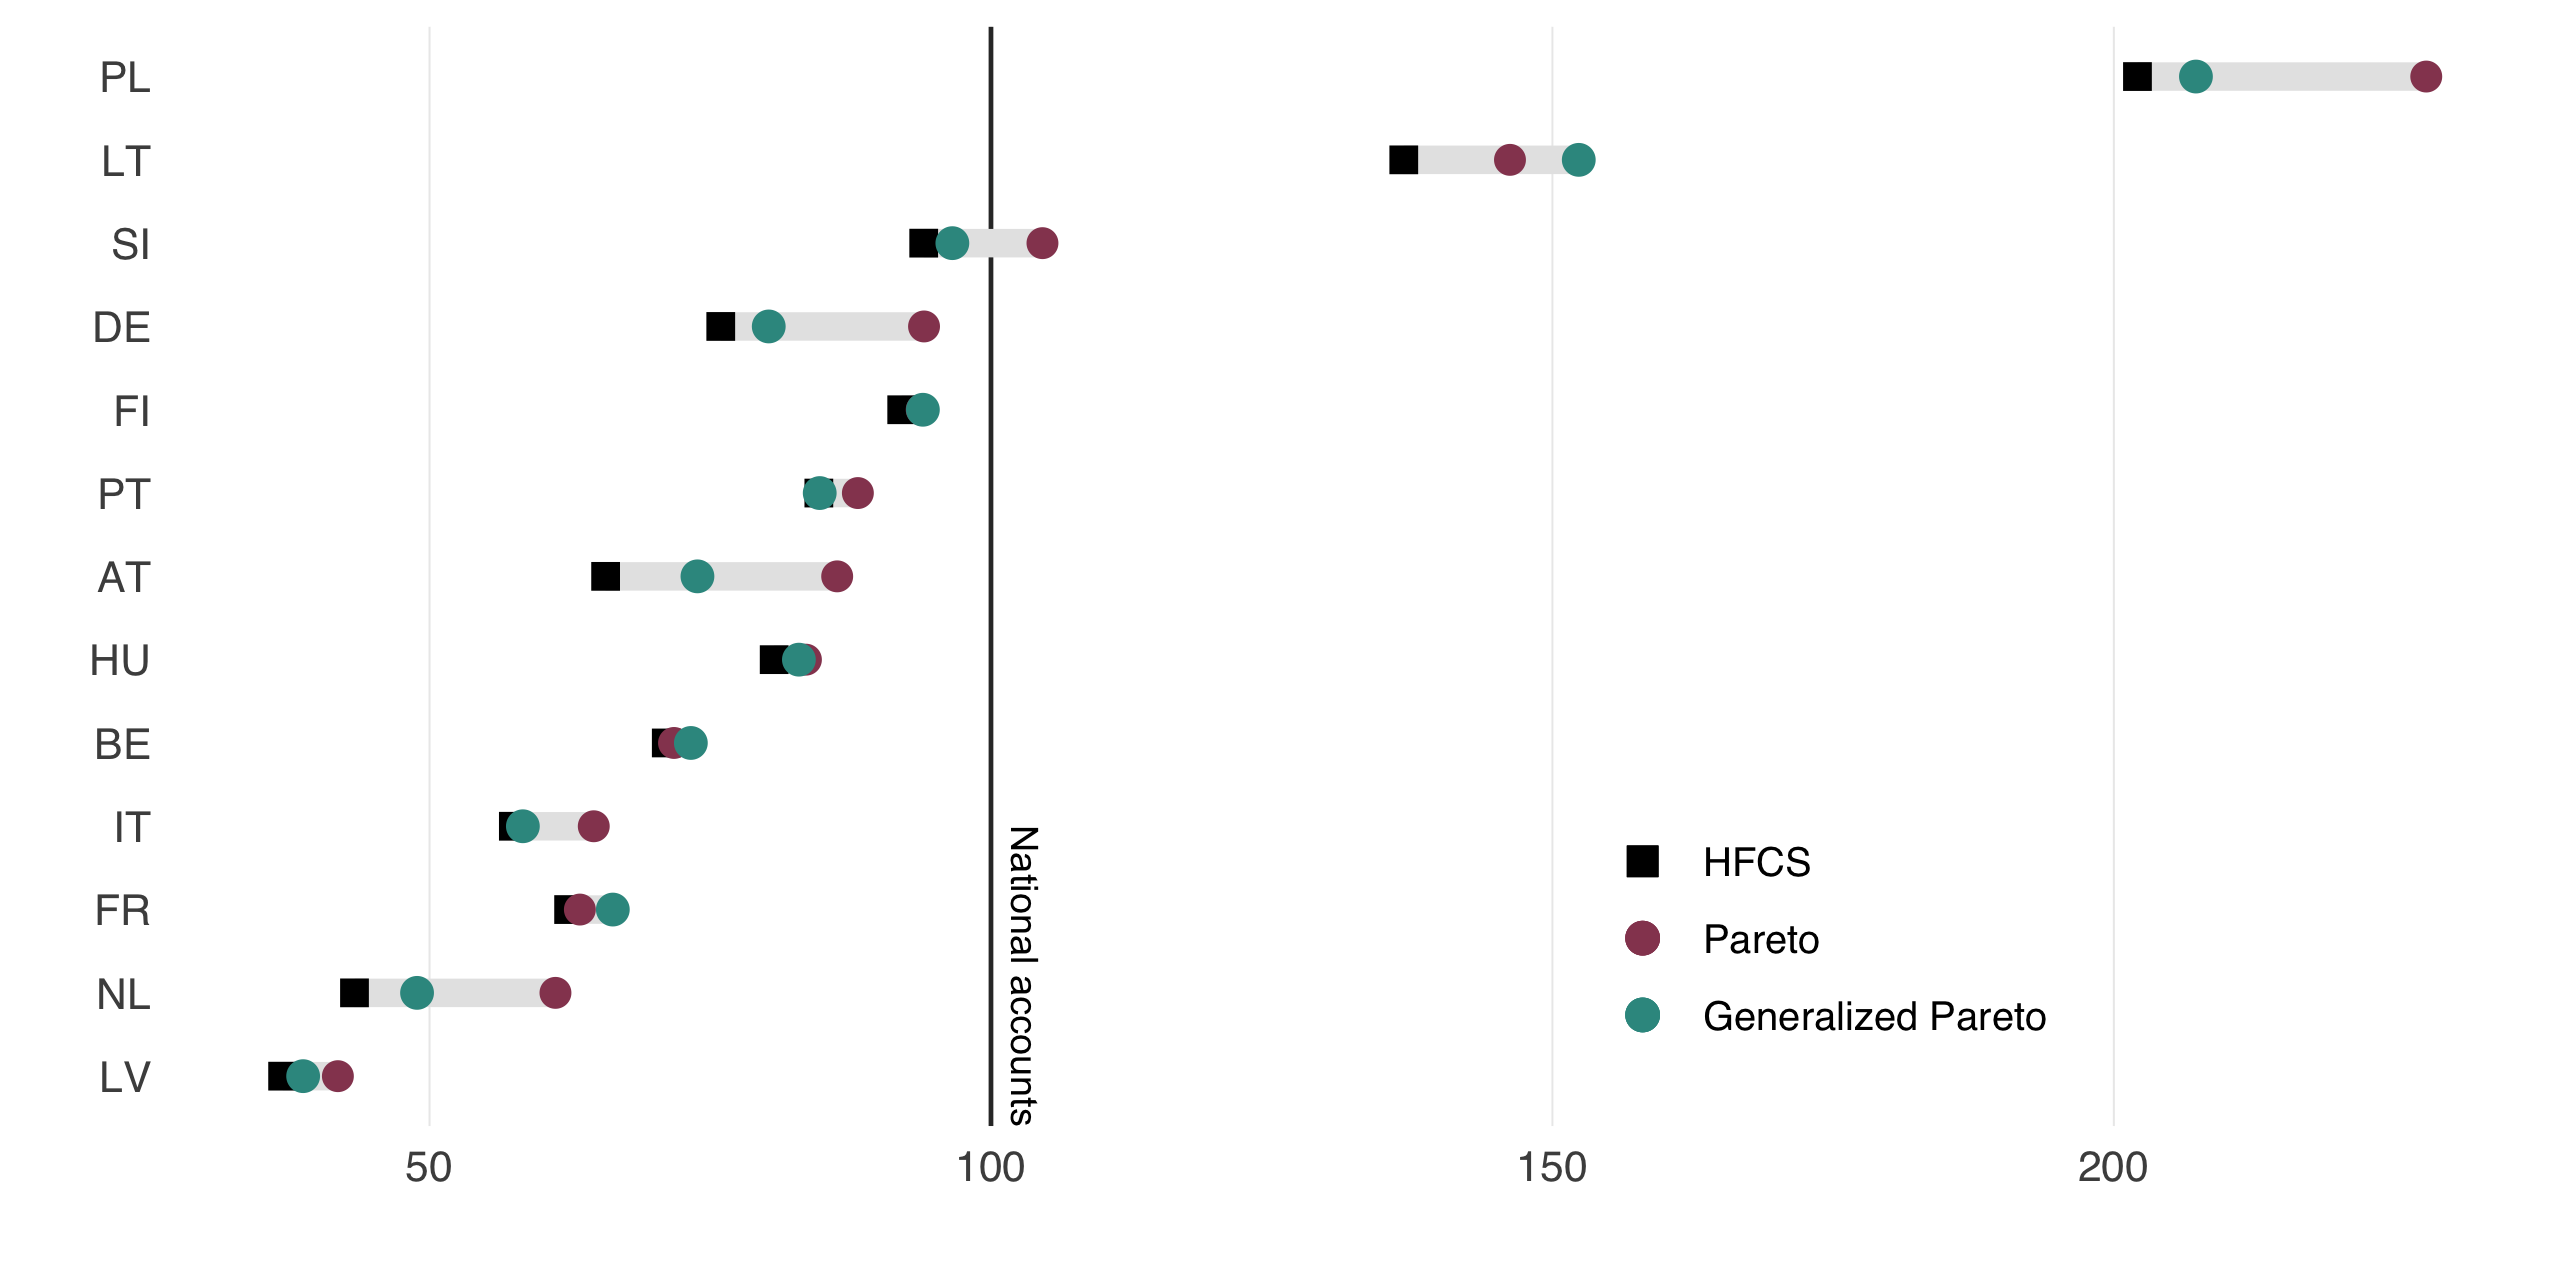
Convergence of adjusted survey data and national accounts

Wealth distribution in Austria

Self-positioning in the wealth distribution

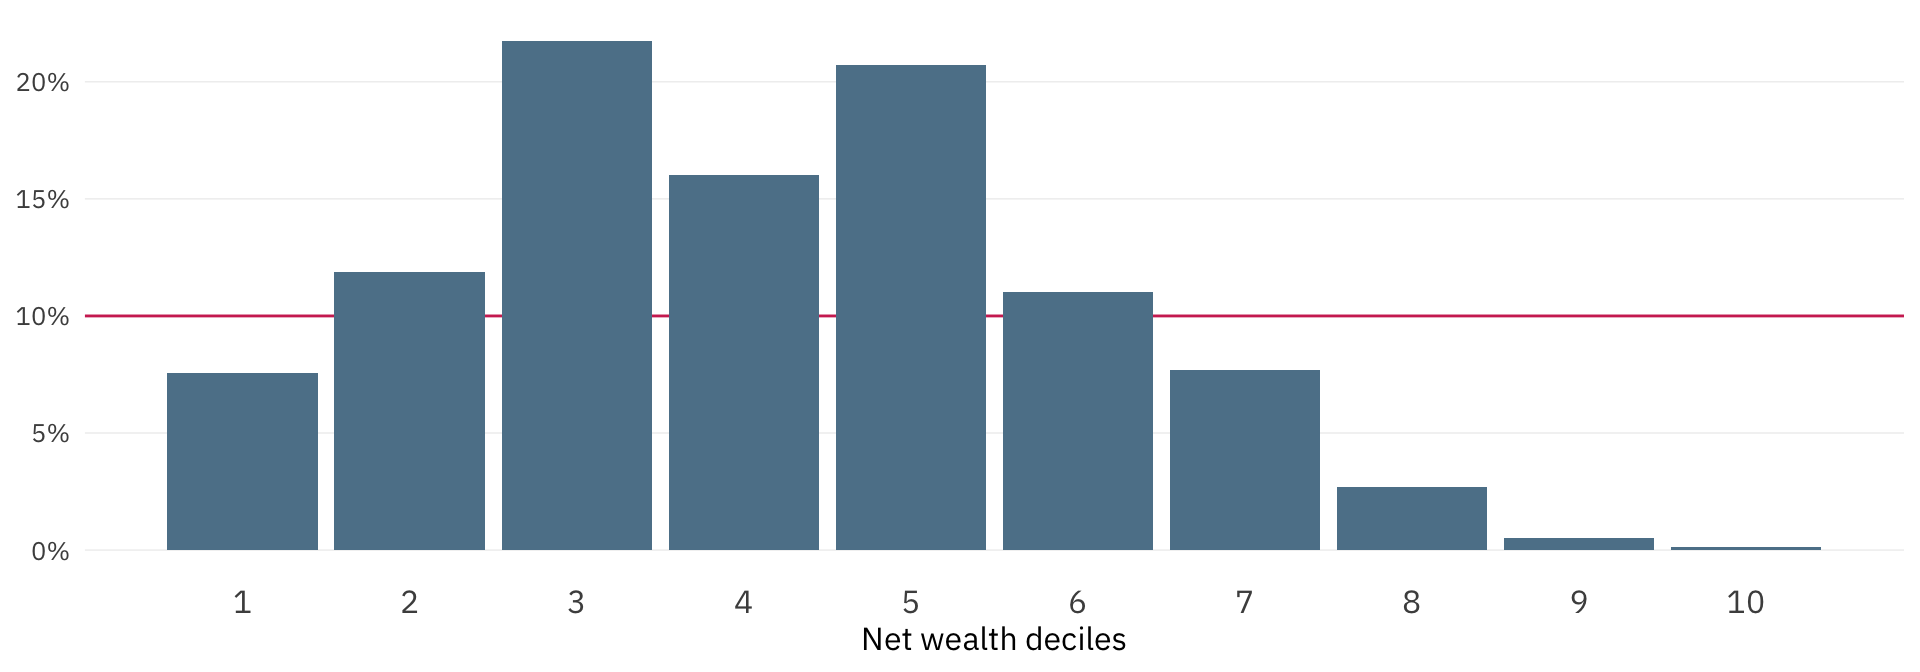
  • Correct positioning of households in the richest decile: 0
  • Average estimated decile in the richest decile: 6
  • Average estimated decile in the poorest decile: 3

Net wealth distribution in Austria

Median: 83,000โ‚ฌ

Average net wealth
of total population:
318,000โ‚ฌ

Average net wealth
of top 1%:
12,500,000โ‚ฌ

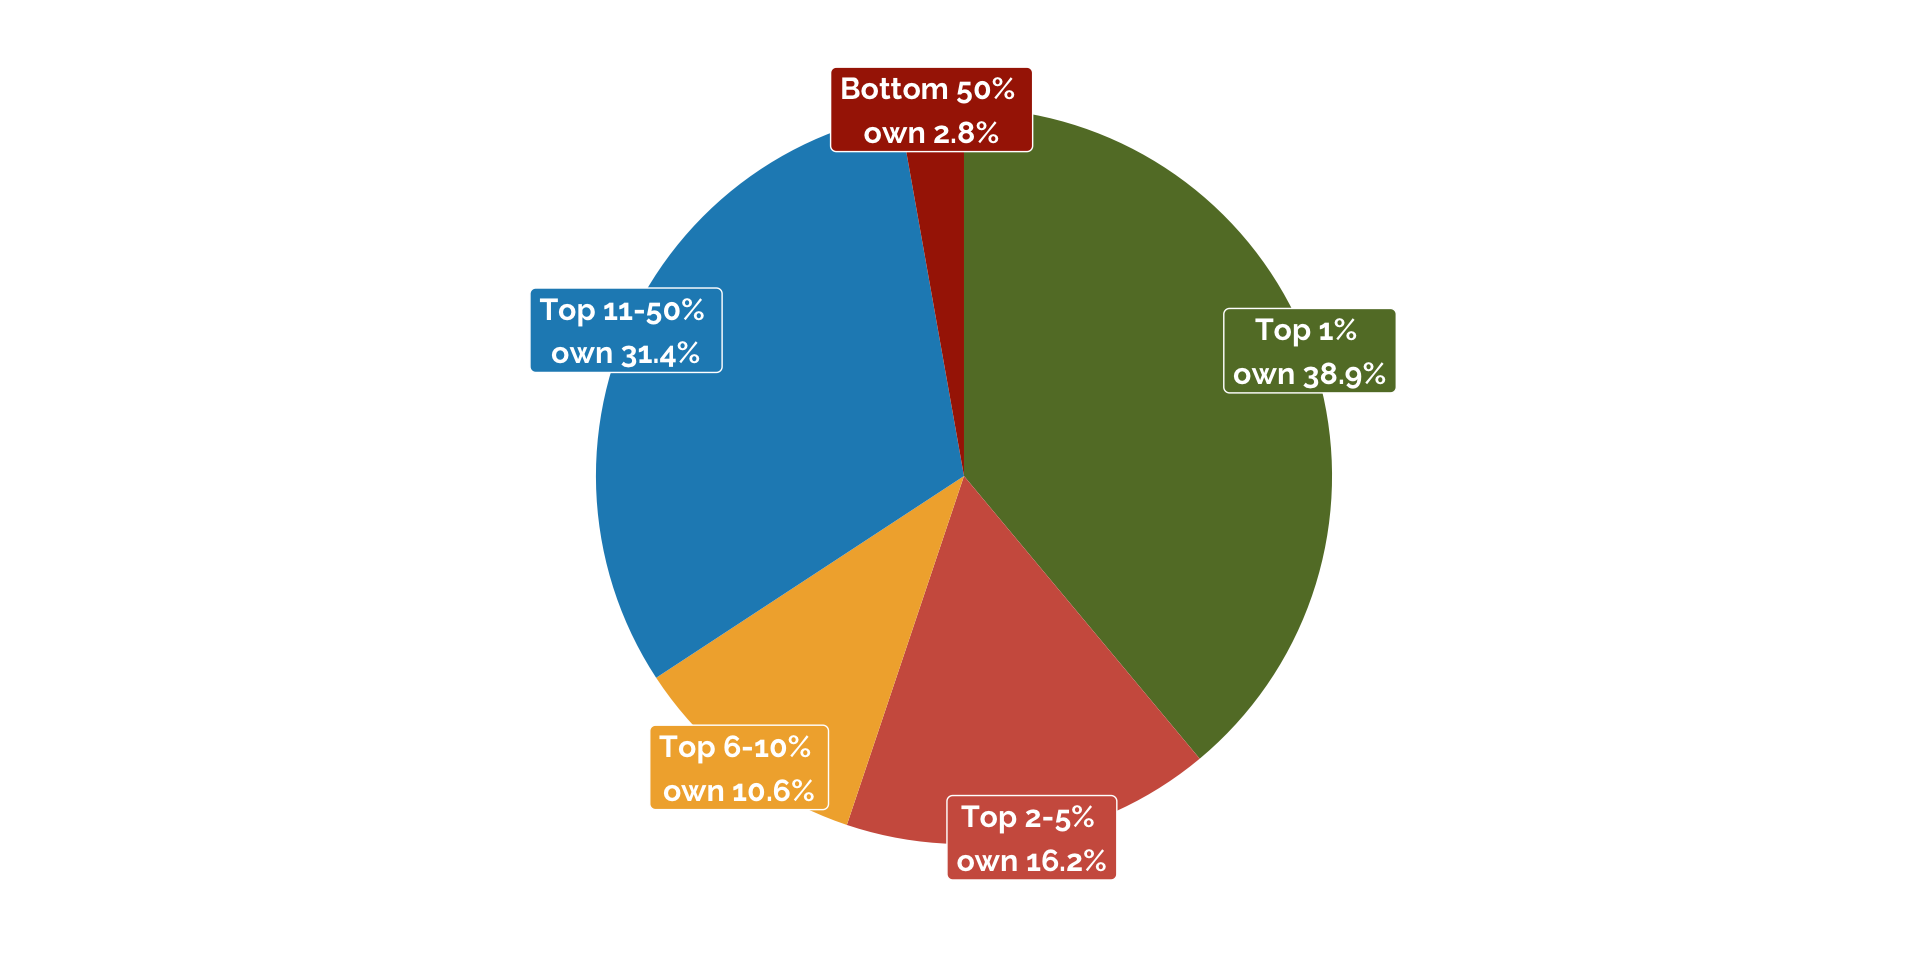
Alternative figure for wealth distribution

Participation in wealth components

Participation in % Bottom half
(0-50%)
Upper middle
(51-80%)
Affluent
(91-95%)
Top 5%
(96-100%)
Vehicles 65.5 87.4 93.2 97.4
Owner-occupied residence 6.2 80.3 94.1 93.2
Other real estate 2.8 14.7 27.9 60.8
Business wealth 2.1 4.8 13.3 50.2
Deposits 99.4 99.6 99.3 100.0
Saving accounts 80.1 91.1 95.5 97.7
Mutual and investment funds 3.6 8.1 19.6 26.9
Bonds 1.2 2.8 5.0 9.7
Shares 1.9 5.8 10.1 15.0

Gender net wealth gap in Austria

Mean wealth Mean GWG (in โ‚ฌ) Mean GWG (in %) Median Wealth Median GWG (in โ‚ฌ) Median GWG (in %)
All respondents
Couples 356,553 173,683
Male 207,485 58,417 28 82,285 13,862 17
Female 149,068 68,422
Male respondent
Male 270,307 110,995 41.1 99,347 27,085 27.3
Female 159,312 72,262
Female respondent
Male 138,830 957 0.7 63,825 โˆ’1,395 -2.2
Female 137,873 65,220

Migrant net wealth gap in Austria

Mean wealth Mean MWG (in โ‚ฌ) Mean MWG (in %) Median Wealth Median MWG (in โ‚ฌ) Median MWG (in %)
Natives 165,730 59,001
Migrants
Total 98,007 67,723 41 15,931 43,070 73
1st generation 63,001 102,729 62 9,917 49,084 83
2nd generation 139,775 25,955 16 32,763 26,238 44
1st generation migrants only
Short stay 39,598 126,132 76 4,935 54,066 92
Long stay 86,317 79,413 48 20,196 38,805 66

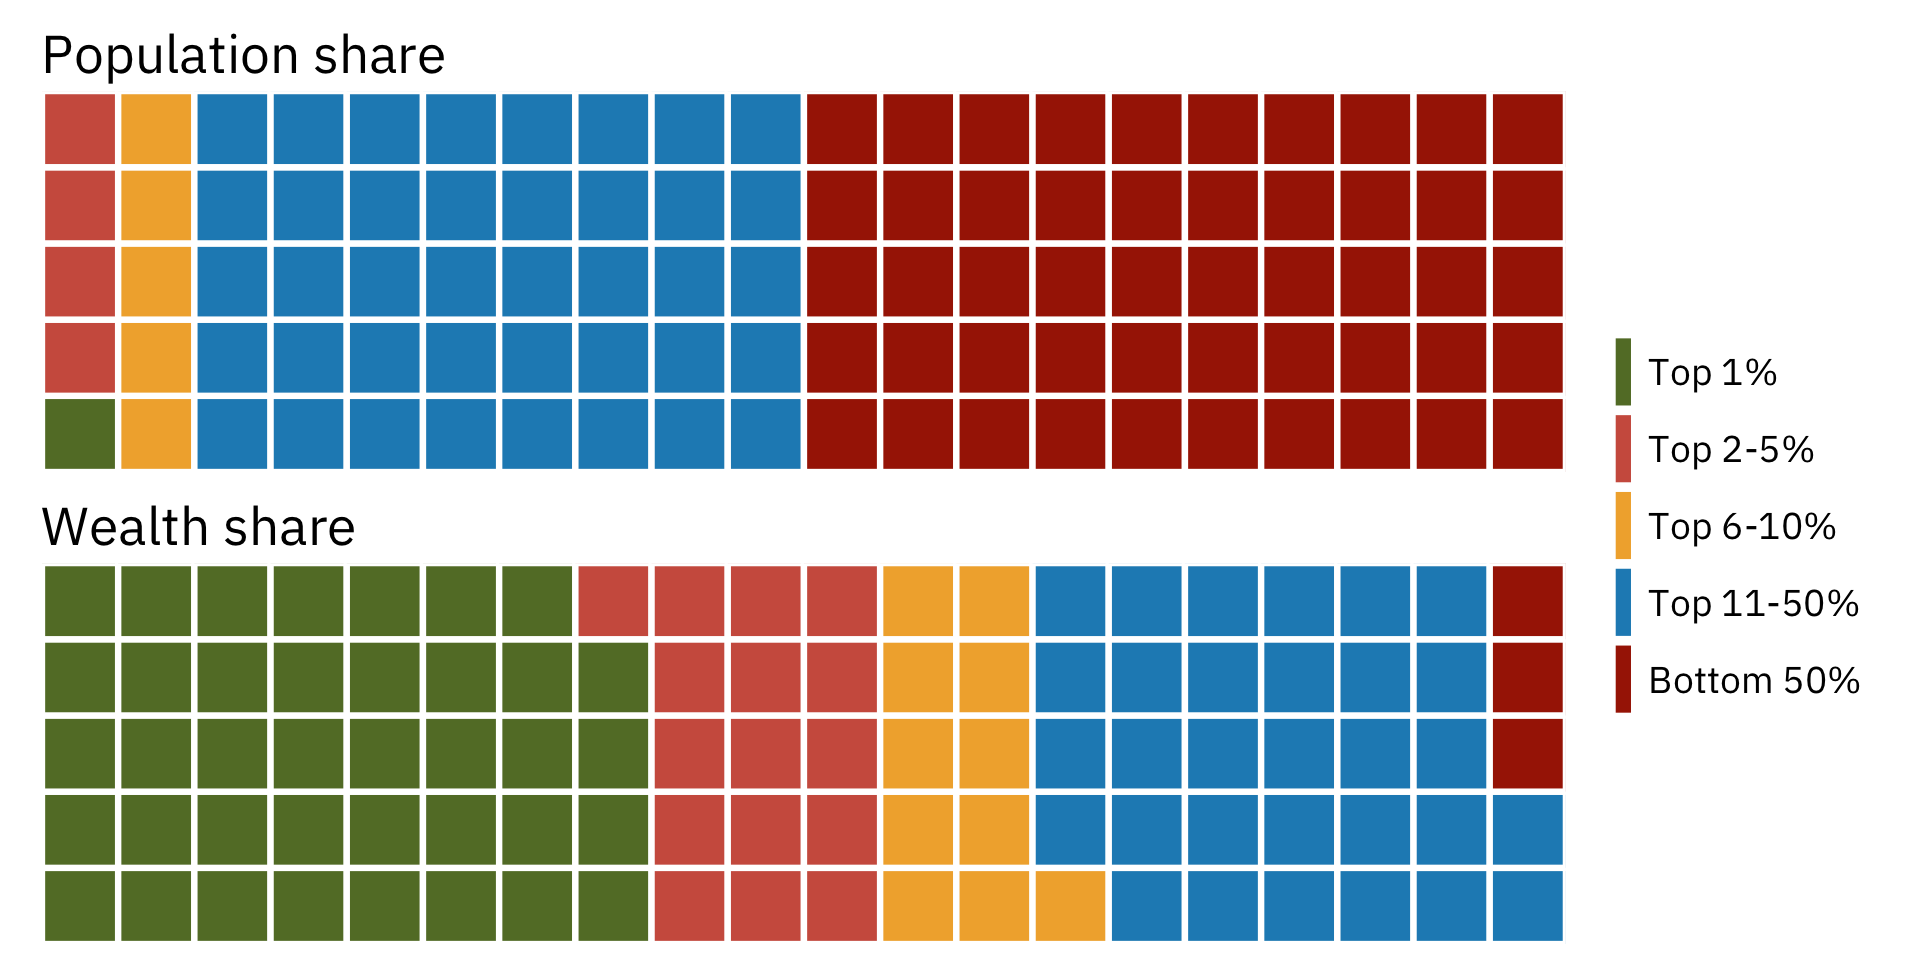
Global wealth distribution

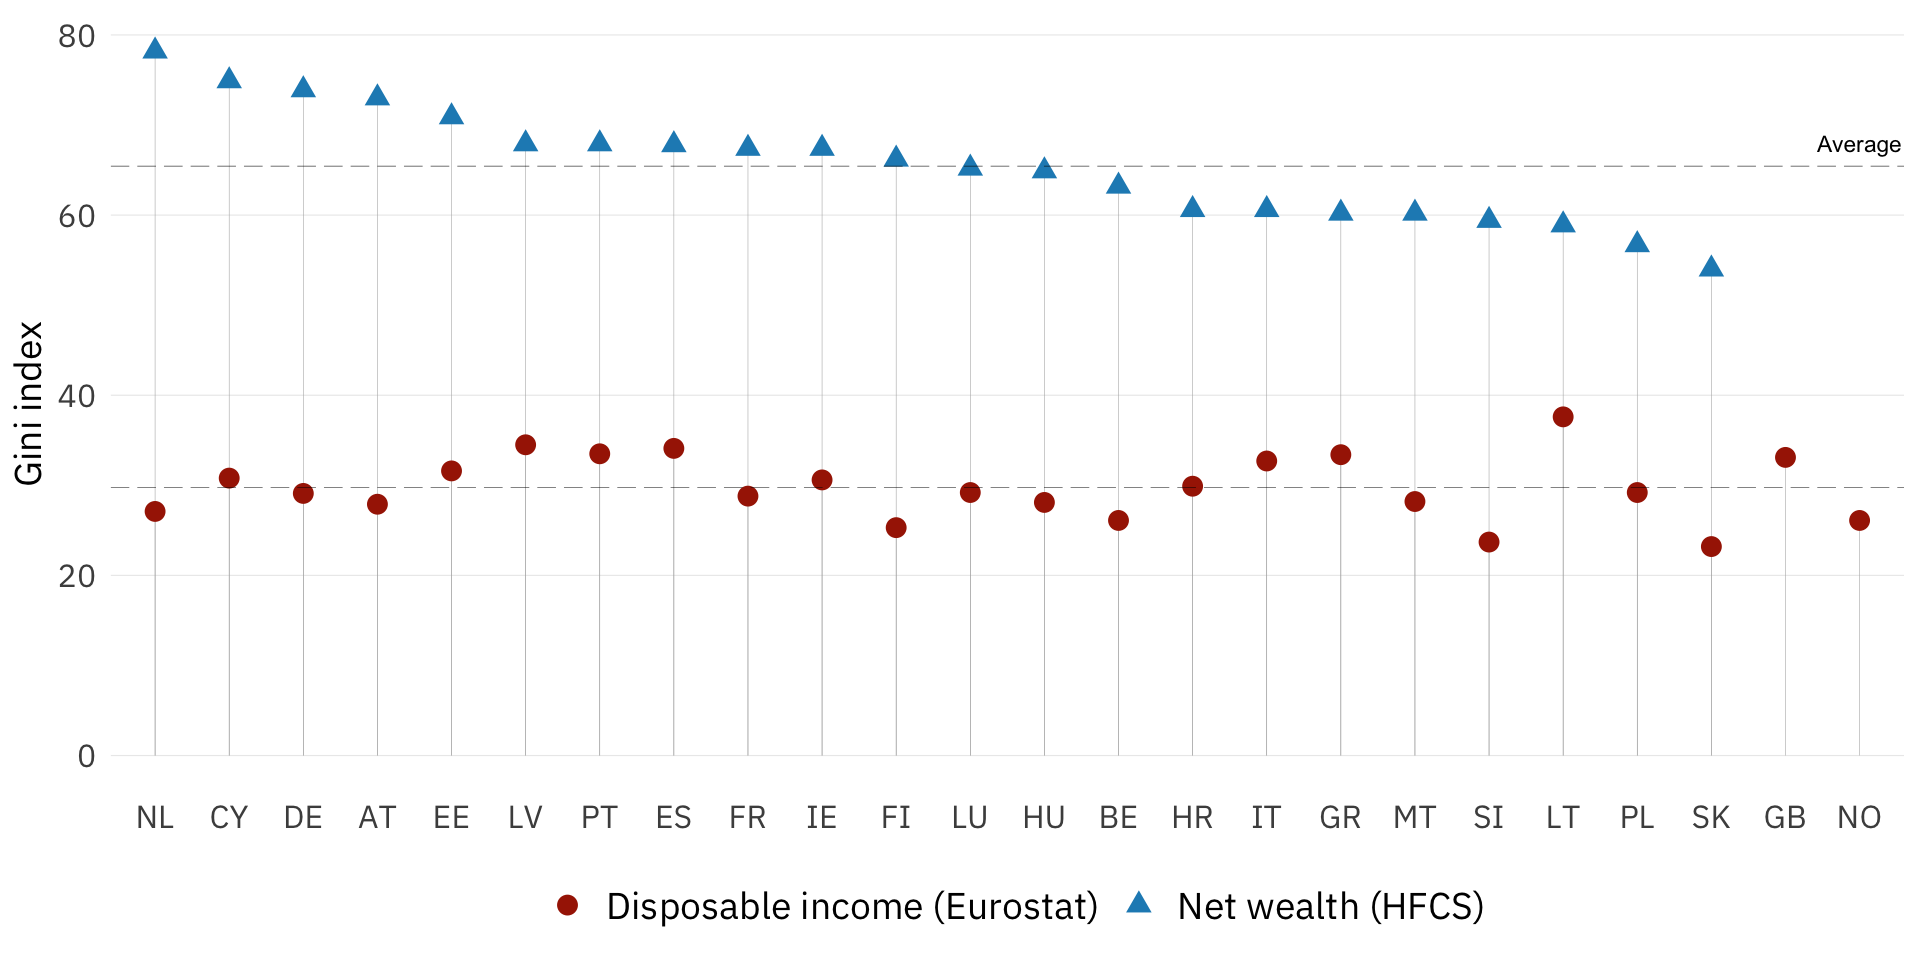
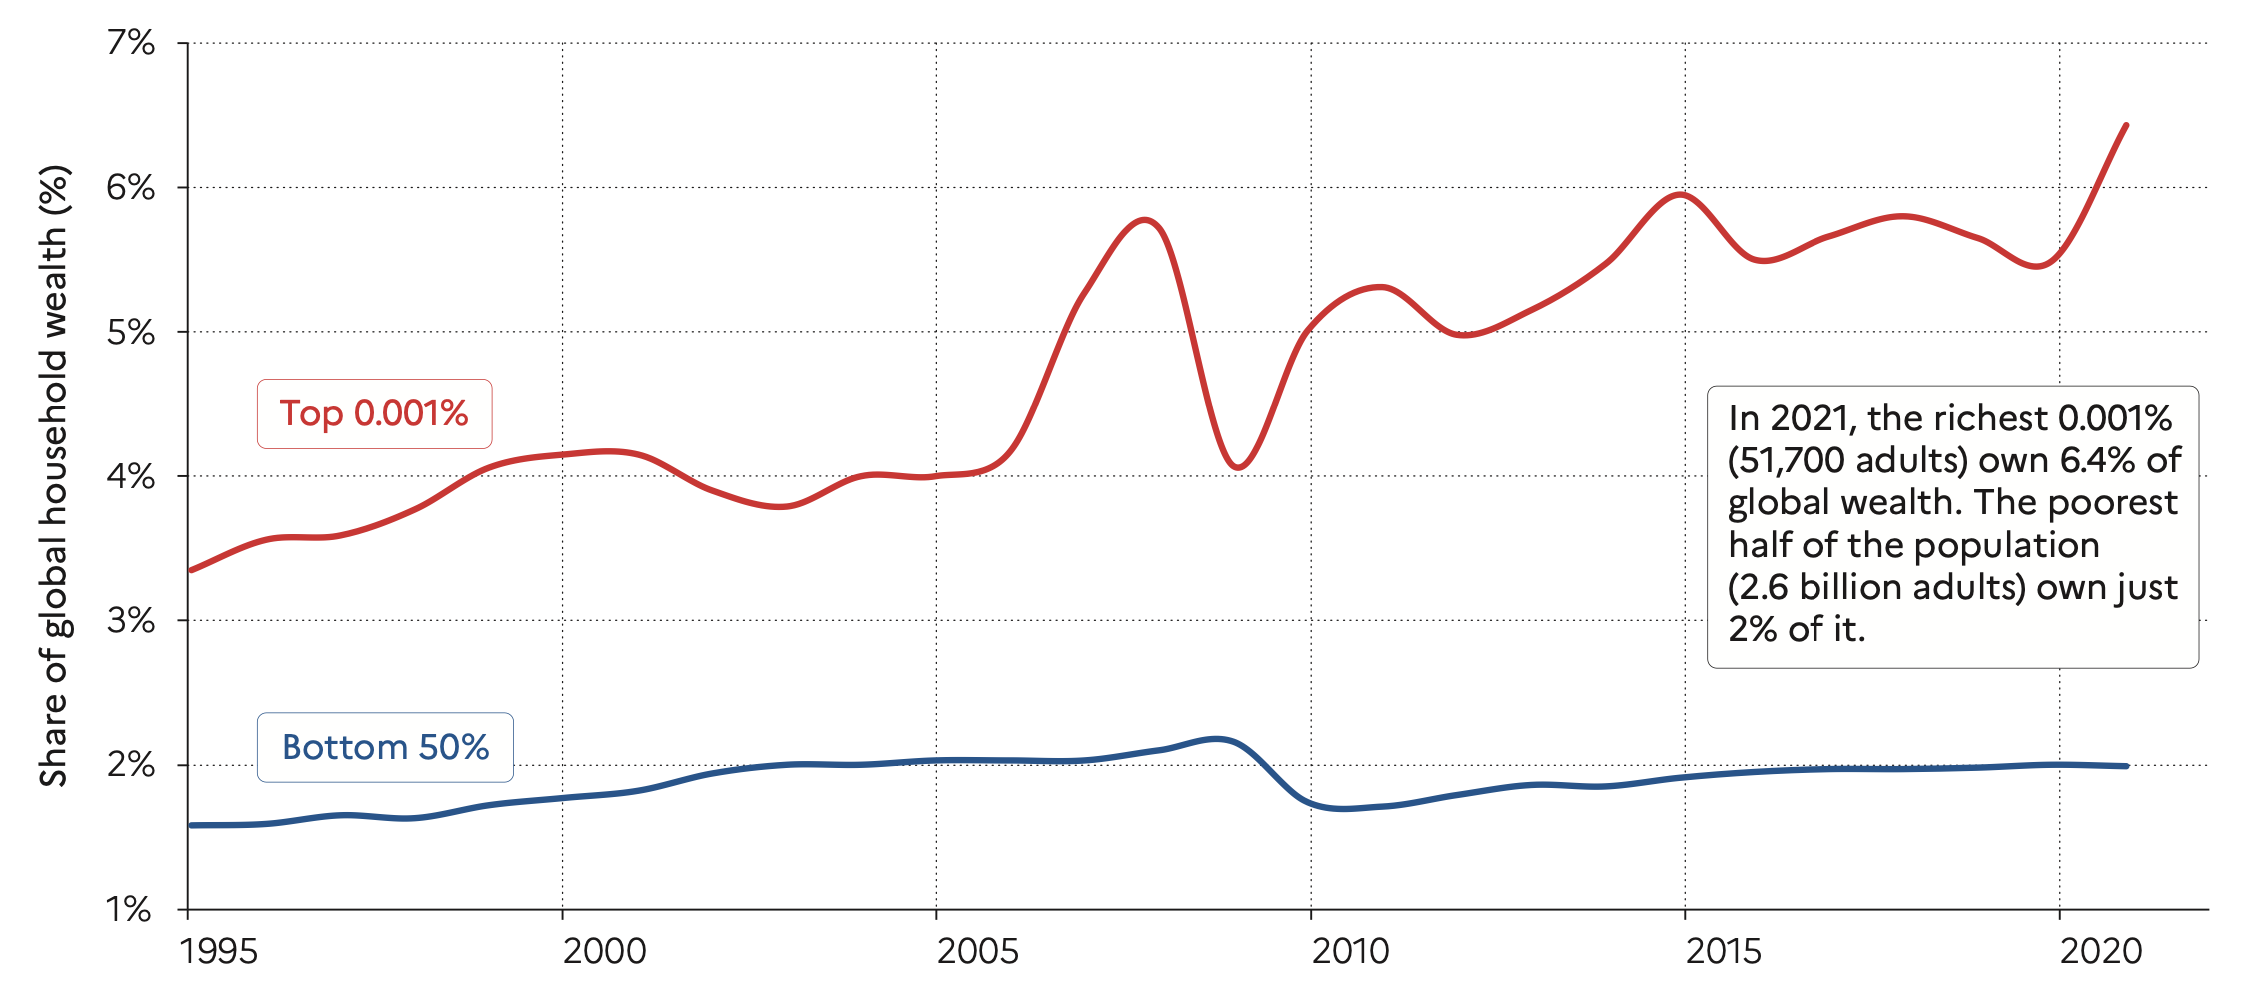
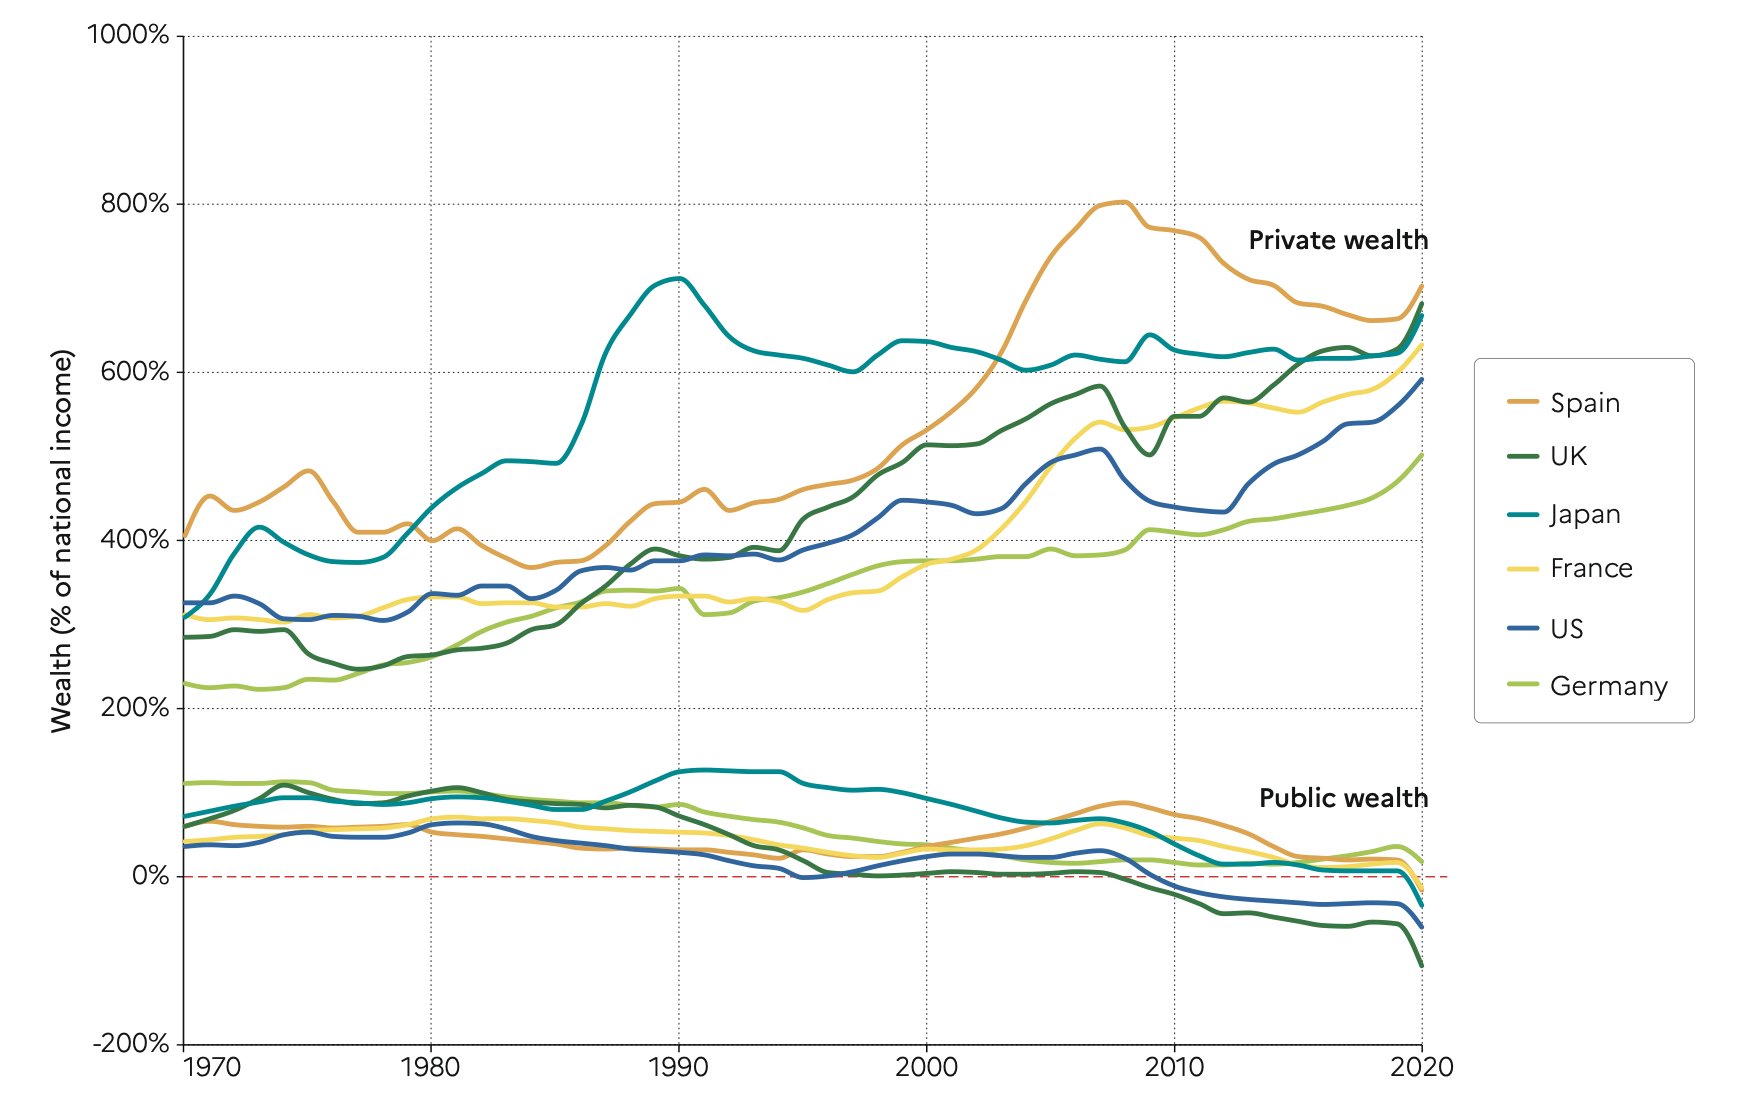
Global income and wealth inequality

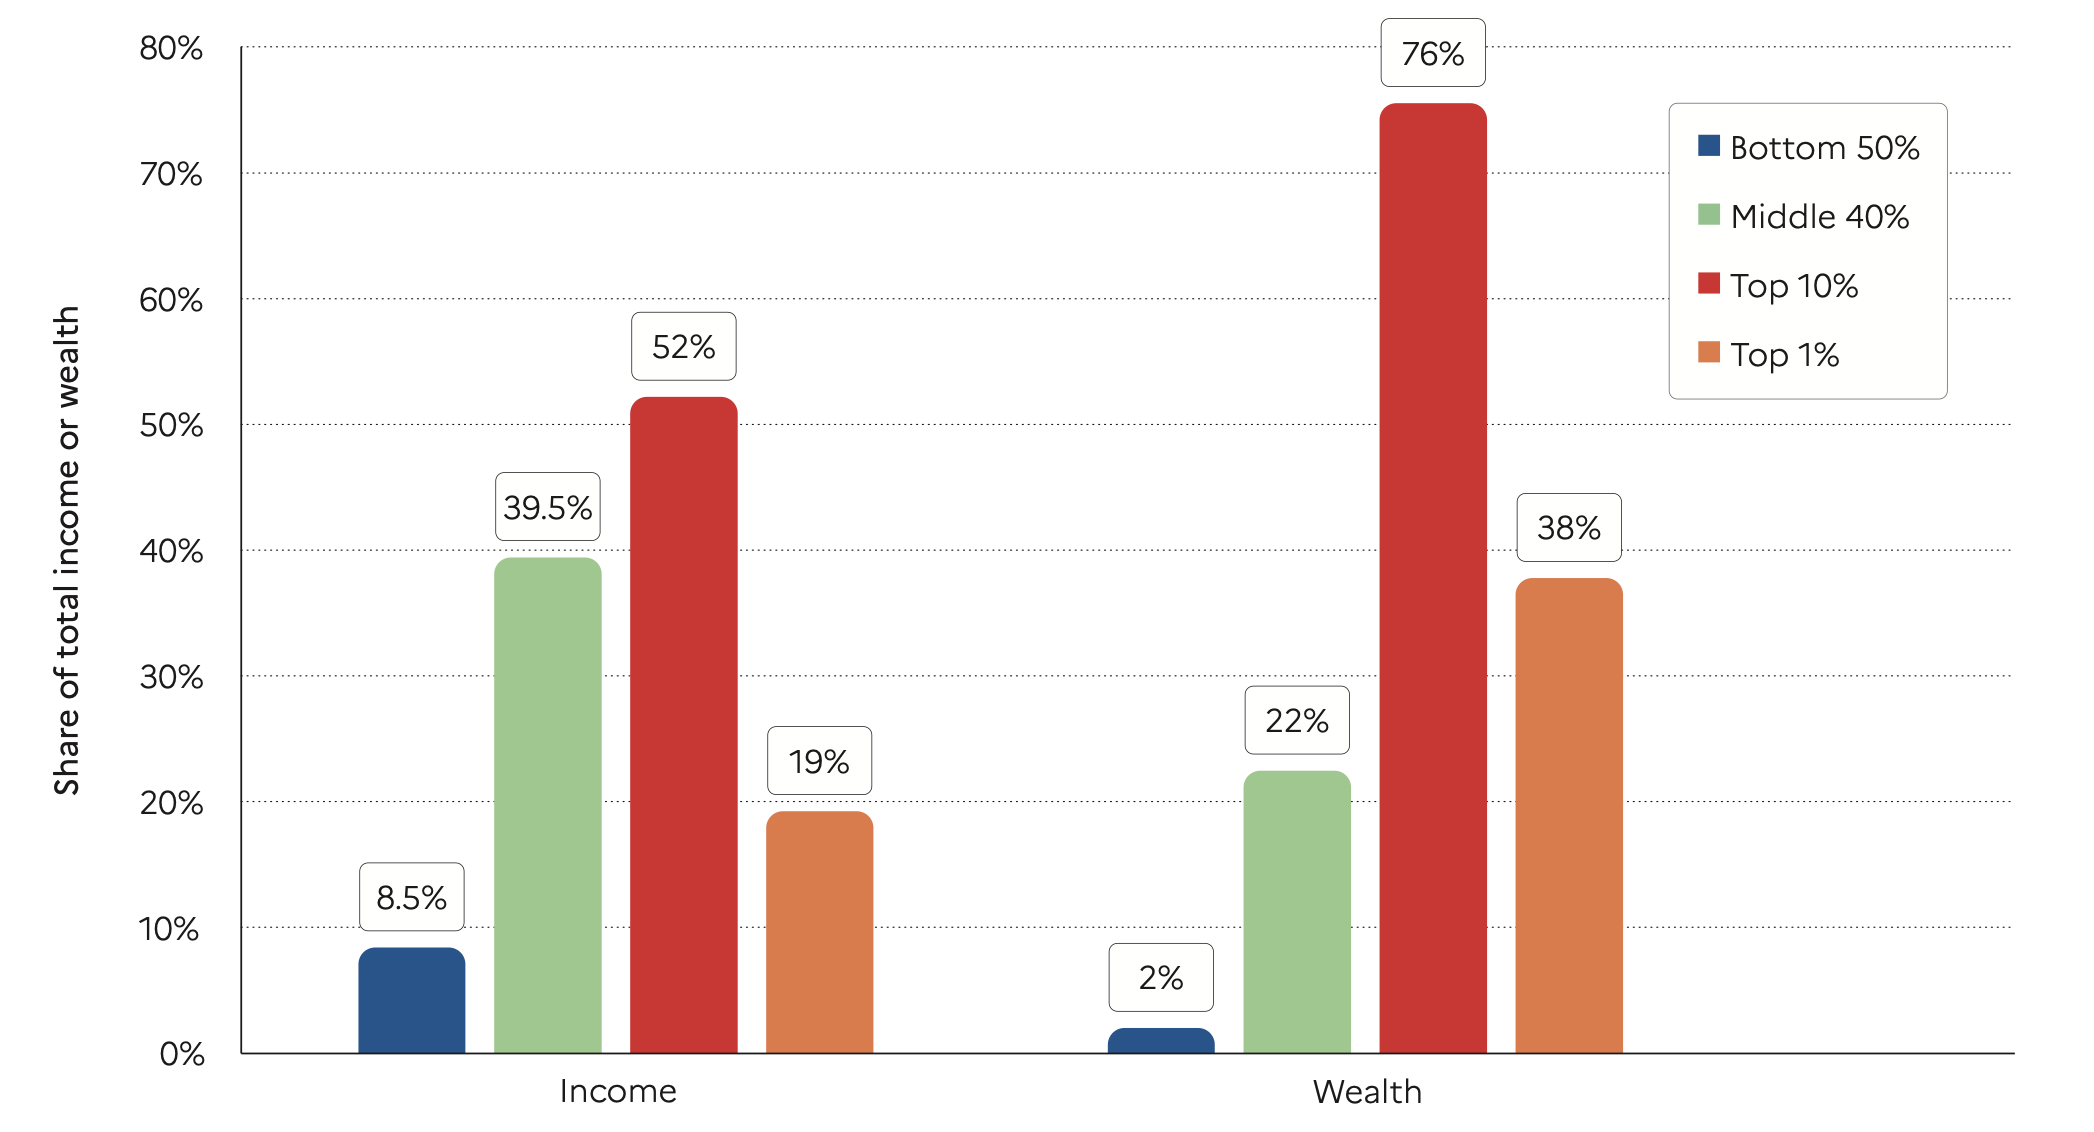
Income and wealth inequality across Europe

Extreme global wealth inequality

Private and public wealth

Bibliography

Chancel, Lucas/Piketty, Thomas/Saez, Emmanuel/Zucman, Gabriel (2022). World inequality report 2022. World Inequality Lab.
Gabaix, Xavier (2016). Power laws in economics: An introduction. Journal of Economic Perspectives, 30(1), 185โ€“206. DOI: 10.1257/jep.30.1.185
Heck, Ines/Kapeller, Jakob/Wildauer, Rafael (2020). Vermรถgenskonzentration in ร–sterreich โ€“ ein update auf basis des HFCS 2017 (AK Working Paper No. 206). AK Wien.
Kennickell, Arthur B./Woodburn, R. Louise (1999). Consistent weight design for the 1989, 1992 and 1995 SCFs, and the distribution of wealth. Review of Income and Wealth, 45(2), 193โ€“215. DOI: 10.1111/j.1475-4991.1999.tb00328.x
Muckenhuber, Mattias/Rehm, Miriam/Schnetzer, Matthias (2022). A tale of integration? The migrant wealth gap in austria. European Journal of Population, 38(2), 163โ€“190. DOI: 10.1007/s10680-021-09604-1
OECD (2013). OECD guidelines for micro statistics on household wealth. OECD. DOI: 10.1787/9789264194878-en
Rehm, Miriam/Schneebaum, Alyssa/Schuster, Barbara (2022). Intra-couple wealth inequality: Whatโ€™s socio-demographics got to do with it? European Journal of Population, 38(4), 681โ€“720. DOI: 10.1007/s10680-022-09633-4
Vermeulen, Philip (2016). Estimating the top tail of the wealth distribution. The American Economic Review, 106(5), 646โ€“650. DOI: 10.1257/aer.p20161021