Economic Policy Visualization

Wealth ยท Themes

Dr. Matthias Schnetzer

May 15, 2023

Definition of private wealth

Non-financial assets

  • Dwellings (owner-occupied residence, other real estate)
  • Consumer durables (vehicles, etc.)
  • Valuables
  • Intellectual property

Financial assets

  • Currency and deposits
  • Net equity in own unincorporated business
  • Mututal funds and investment funds
  • (Private) Pensions funds
  • Bonds and other debt securities
  • Shares and other equity
  • Life insurance funds -Other financial assets

Liabilities

  • Owner-occupied residence loans
  • Consumer durable loans (e.g. for vehicles)
  • Other investment loans (collateralized)
  • Other loans (e.g. education loans)

No human, social and cultural capital; No public social security pensions (marketable vs. augmented wealth)

HFCS sampling and underreporting

  • Target population in Austria: 3.9 million households
  • Gross sample in HFCS 2017: 6,280 households
  • Realized interviews: 3,072 households
  • Response rate in HFCS 2017: approx. 50%
  • Residual: refused interviews, invalid addresses, households not available, etc.
  • Response refusal correlates with wealth and is highest at the top (Vermeulen, 2016)
  • Wealthy households own a greater number of assets and miss some components more easily (Kennickell/Woodburn, 1999)

Upstream strategy against underreporting: Oversampling

  • Undercoverage and Underreporting
  • Oversampling is crucial for wealth surveys
  • Oversampling in HFCS 2017: ๐Ÿ‡ง๐Ÿ‡ช ๐Ÿ‡จ๐Ÿ‡พ ๐Ÿ‡ฉ๐Ÿ‡ช ๐Ÿ‡ช๐Ÿ‡ช ๐Ÿ‡ช๐Ÿ‡ธ ๐Ÿ‡ซ๐Ÿ‡ฎ ๐Ÿ‡ซ๐Ÿ‡ท ๐Ÿ‡ฌ๐Ÿ‡ท ๐Ÿ‡ญ๐Ÿ‡ท ๐Ÿ‡ญ๐Ÿ‡บ ๐Ÿ‡ฎ๐Ÿ‡ช ๐Ÿ‡ฑ๐Ÿ‡ป ๐Ÿ‡ฑ๐Ÿ‡น ๐Ÿ‡ฑ๐Ÿ‡บ ๐Ÿ‡ต๐Ÿ‡ฑ ๐Ÿ‡ต๐Ÿ‡น ๐Ÿ‡ธ๐Ÿ‡ฐ
  • No oversampling: ๐Ÿ‡ฆ๐Ÿ‡น ๐Ÿ‡ฎ๐Ÿ‡น ๐Ÿ‡ฒ๐Ÿ‡น ๐Ÿ‡ณ๐Ÿ‡ฑ ๐Ÿ‡ธ๐Ÿ‡ฎ
  • How does oversampling work?
    • External personal wealth data (๐Ÿ‡ซ๐Ÿ‡ท ๐Ÿ‡ช๐Ÿ‡ธ)
    • List of streets with high-income people (๐Ÿ‡ฉ๐Ÿ‡ช ๐Ÿ‡ธ๐Ÿ‡ฐ)
    • Income tax data (๐Ÿ‡ฑ๐Ÿ‡บ 20% of the sample from top 10% earners)
    • Regions with higher average income (๐Ÿ‡ต๐Ÿ‡ฑ)

Downstream strategy against underreporting: Pareto estimation

  • Pareto-Distribution is a sensible approximation to the distribution of large wealth
  • Two parameters:
    • Threshold for โ€œlargeโ€ wealth \(m\)
    • Pareto-Index \(\alpha\)

\[P_i(x_i) = Pr(X_i \leqslant x_i) = 1 - \left(\frac{m_i}{x_i}\right)^{\alpha_i}\] \[\forall ~\text{implicates} ~i = 1...5 \wedge x_i \geqslant m_i\]

A smaller \(\alpha\) means greater inequality. Empirically, \(\alpha\) often is around 1.5 for wealth.
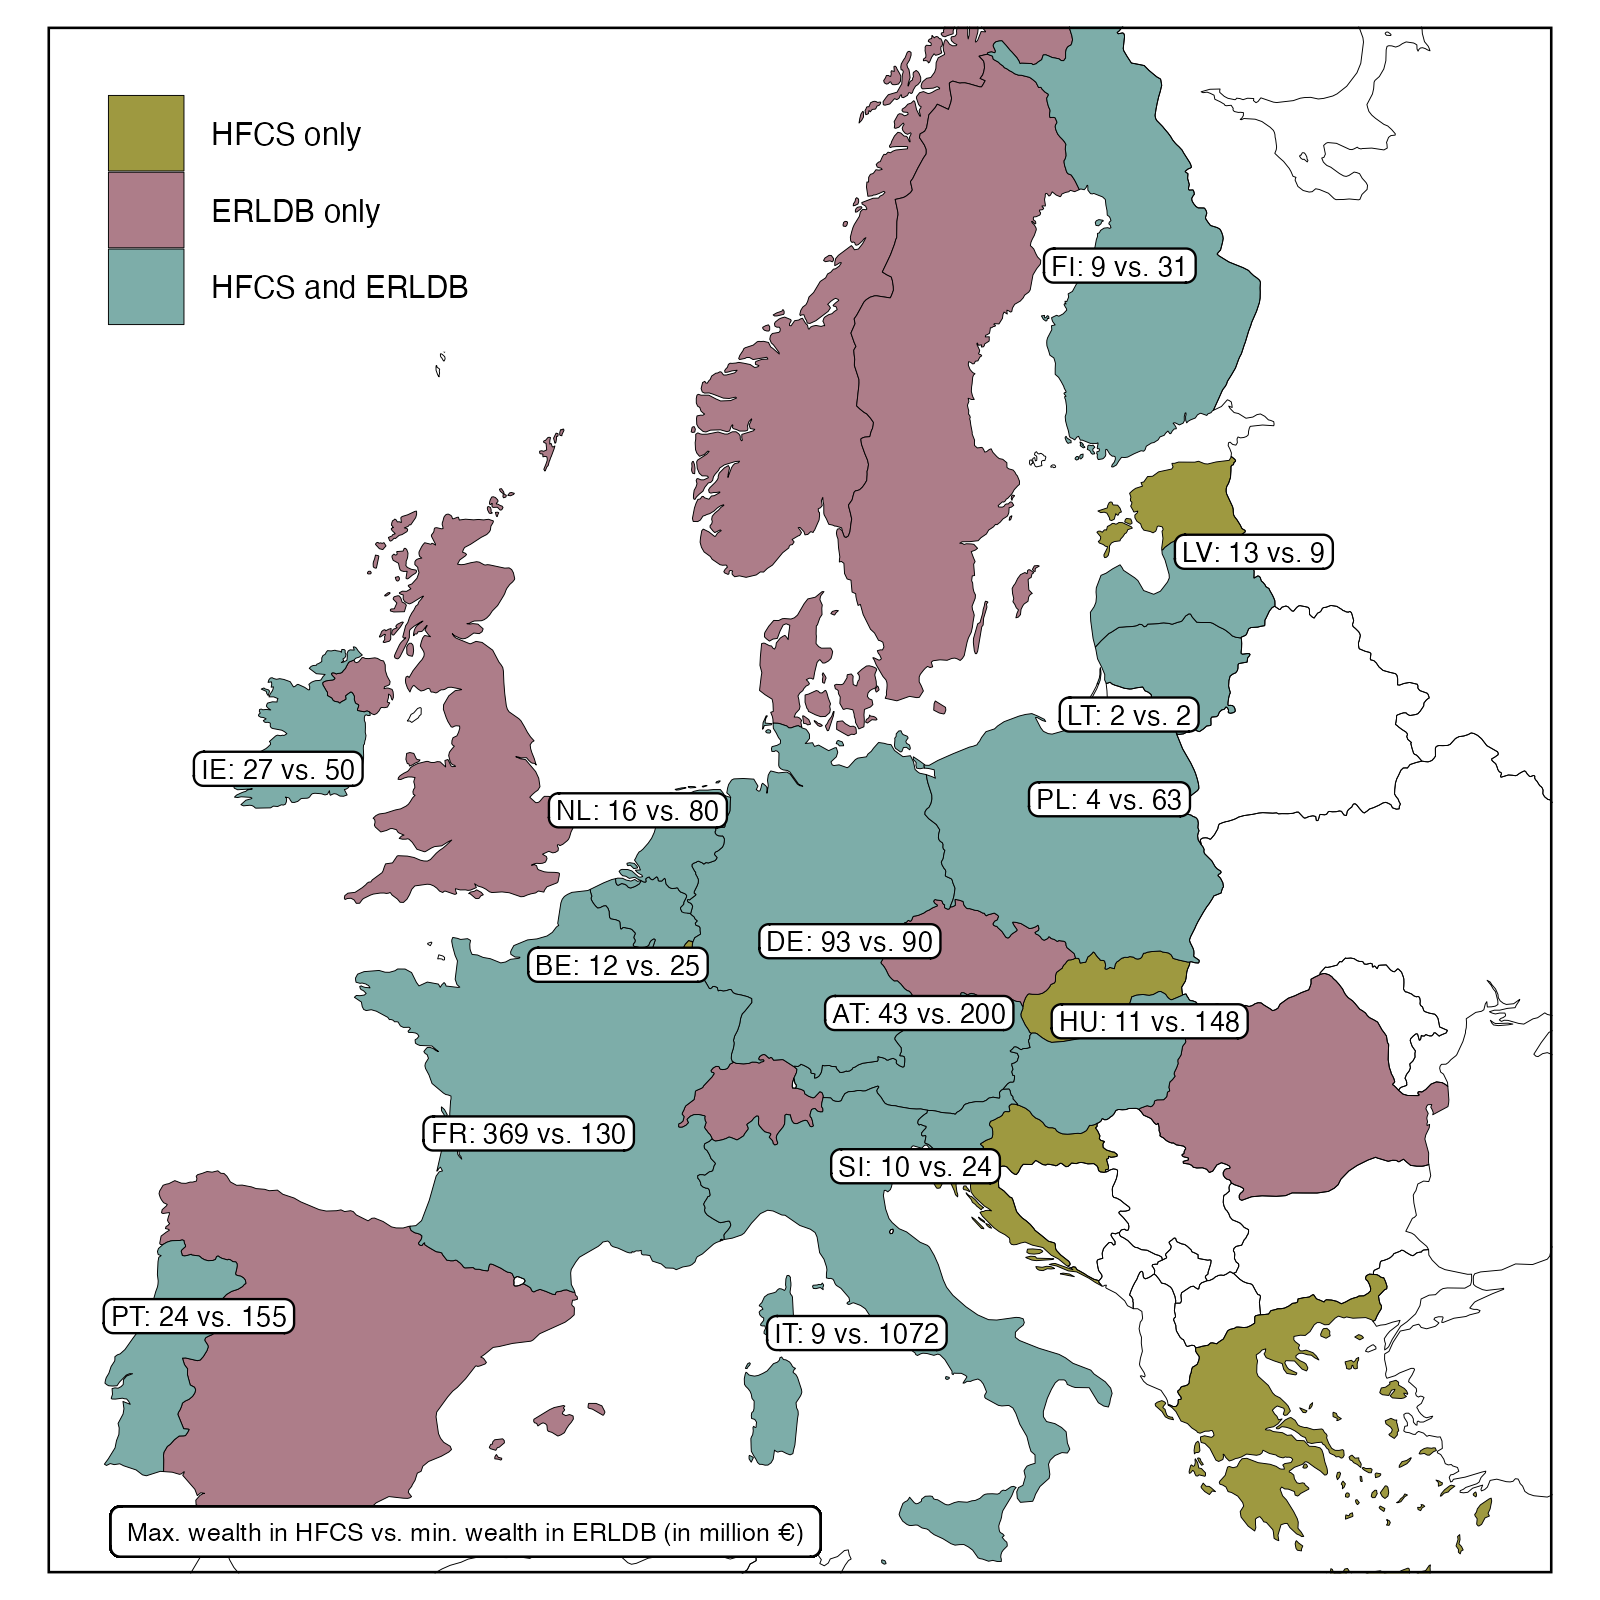
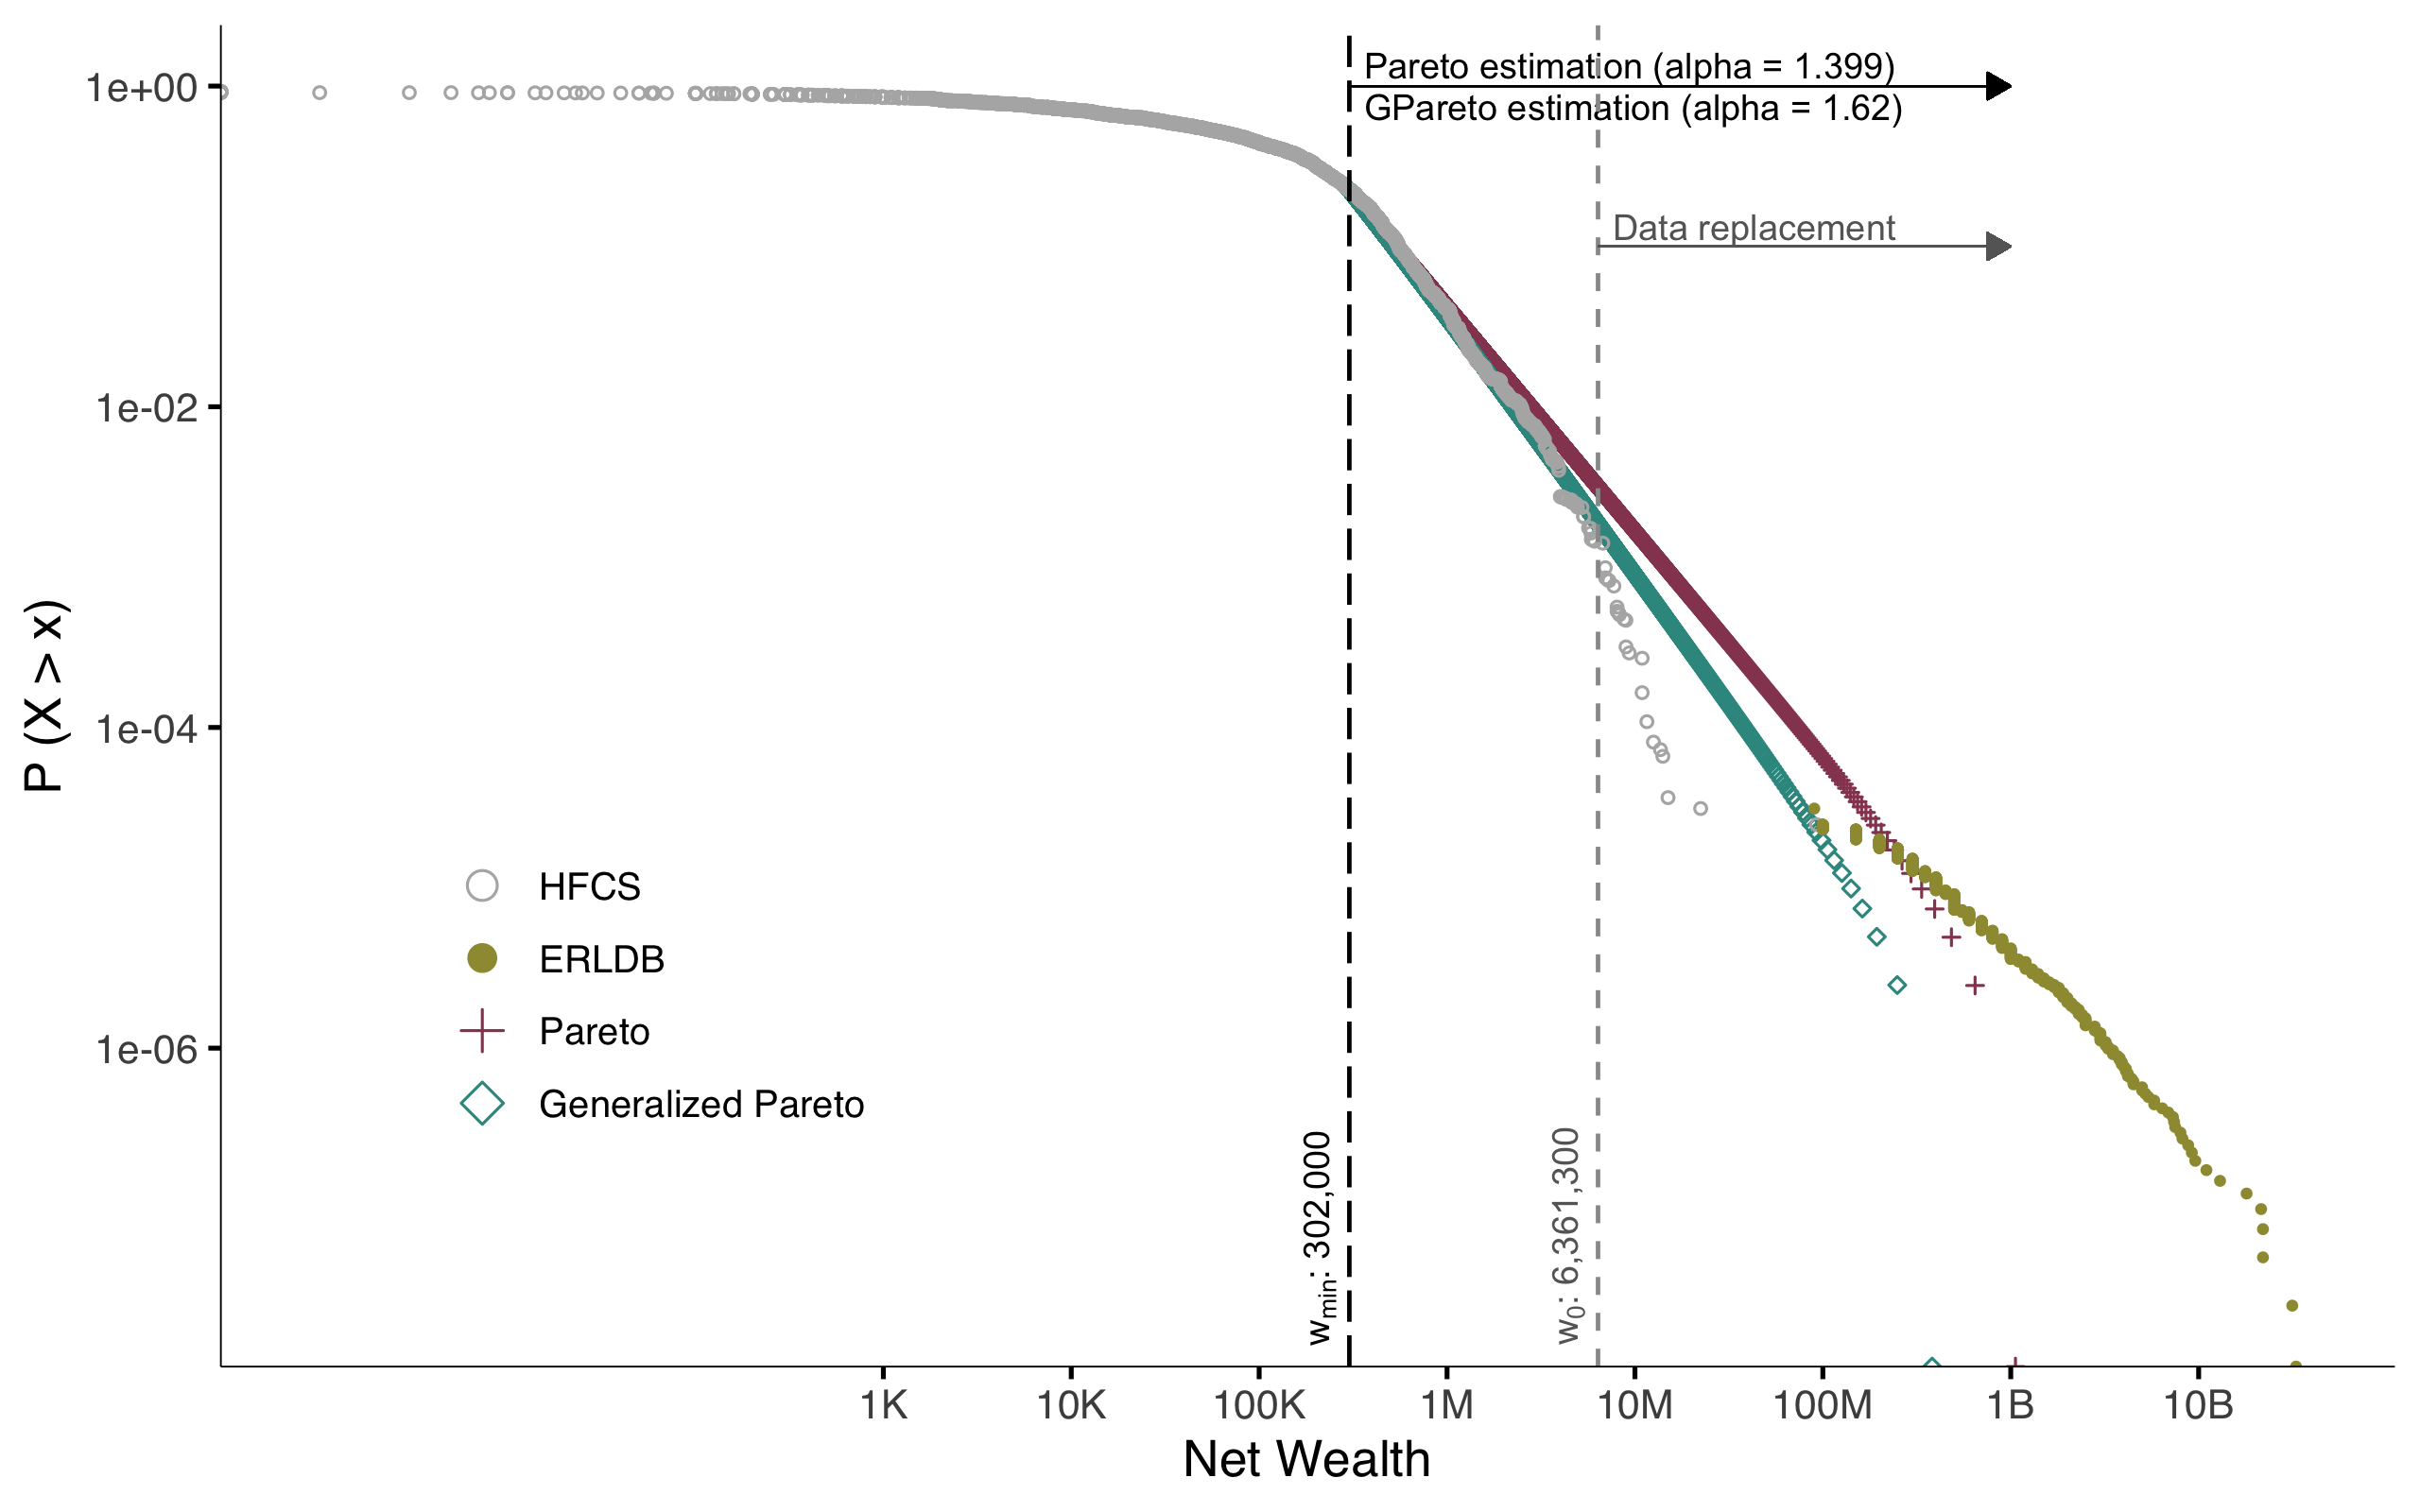
European Rich List Database (ERLDB) and HFCS

Cumulative density function of wealth in Germany

Net wealth distribution in Austria

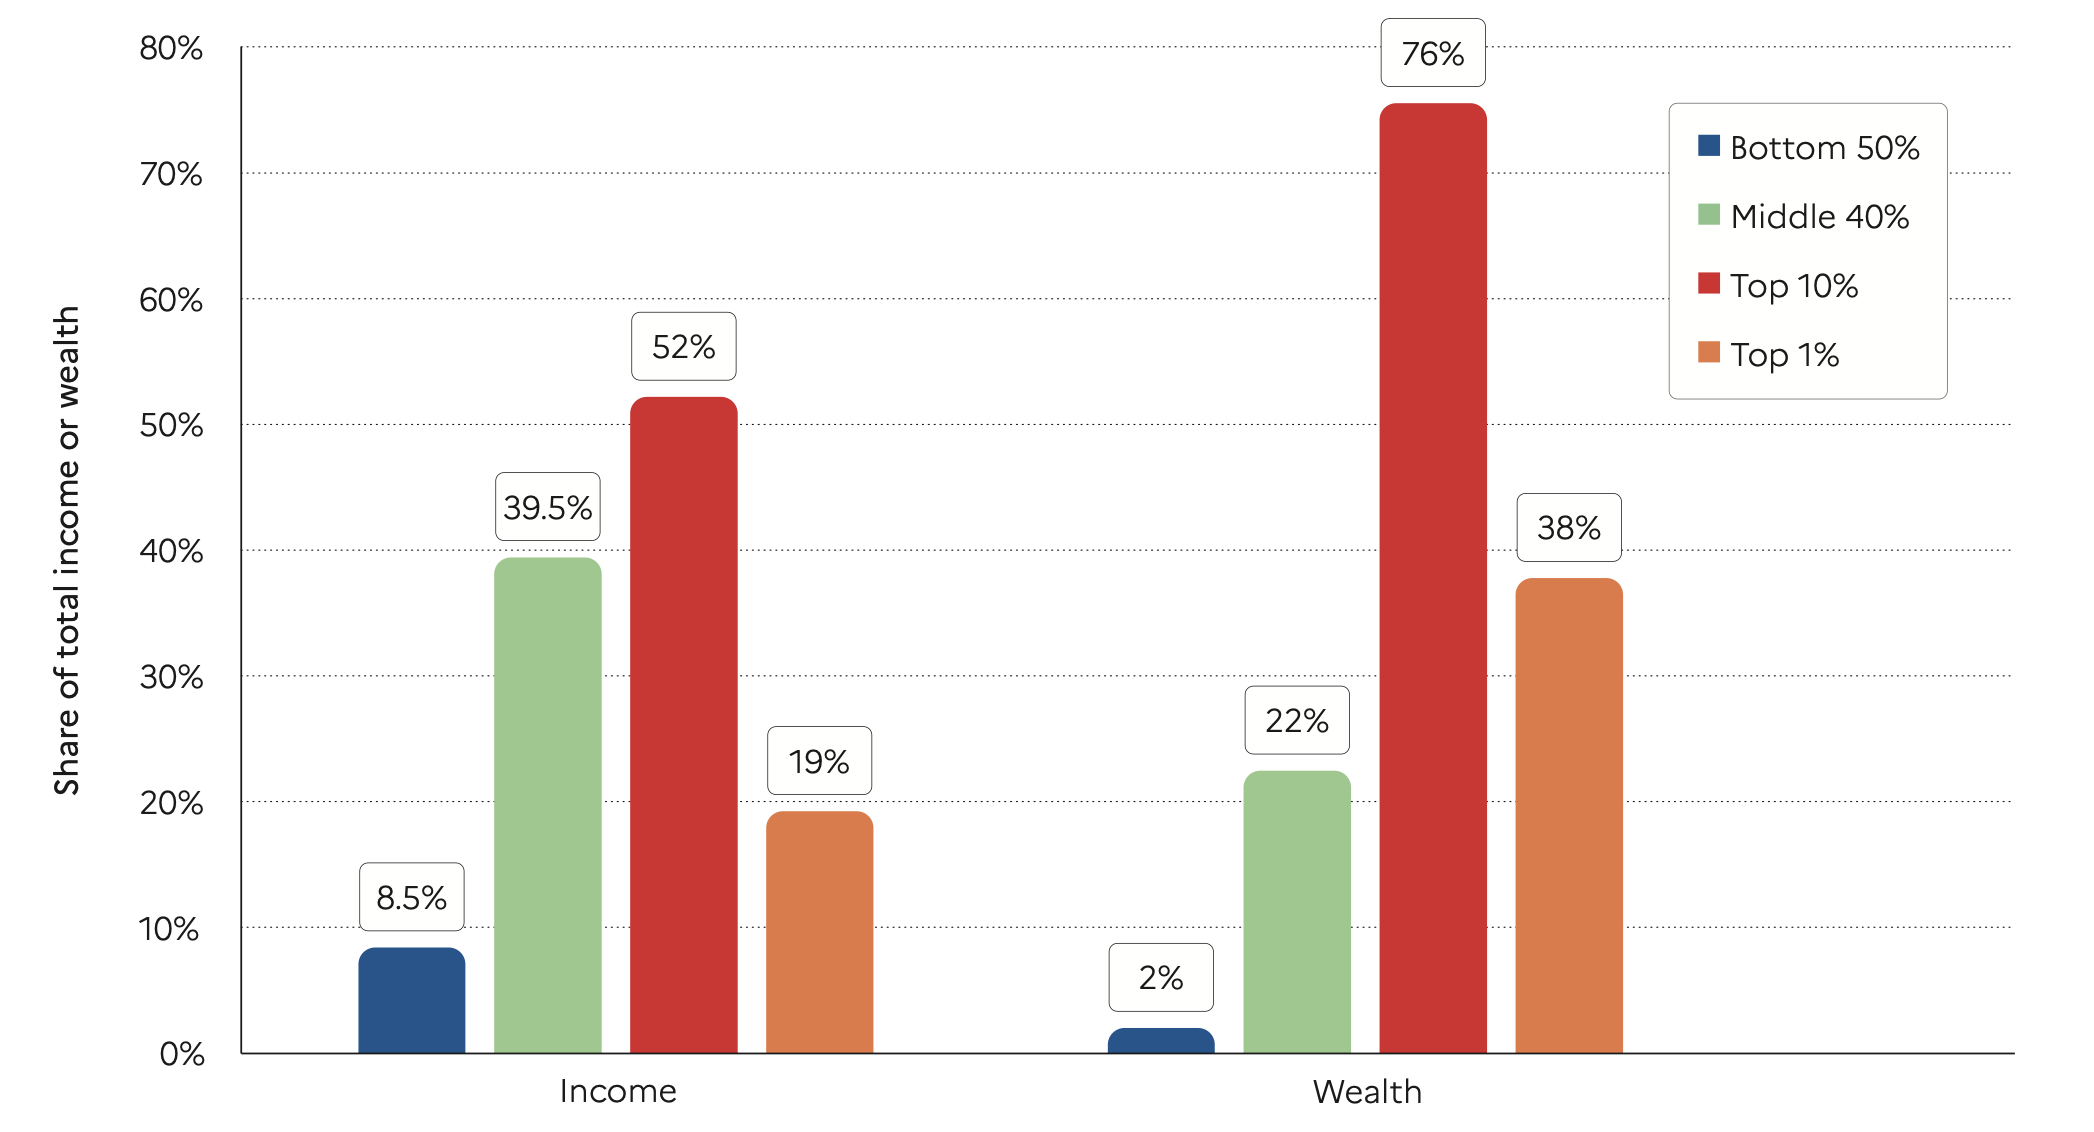
Income and wealth inequality across Europe

Global income and wealth inequality

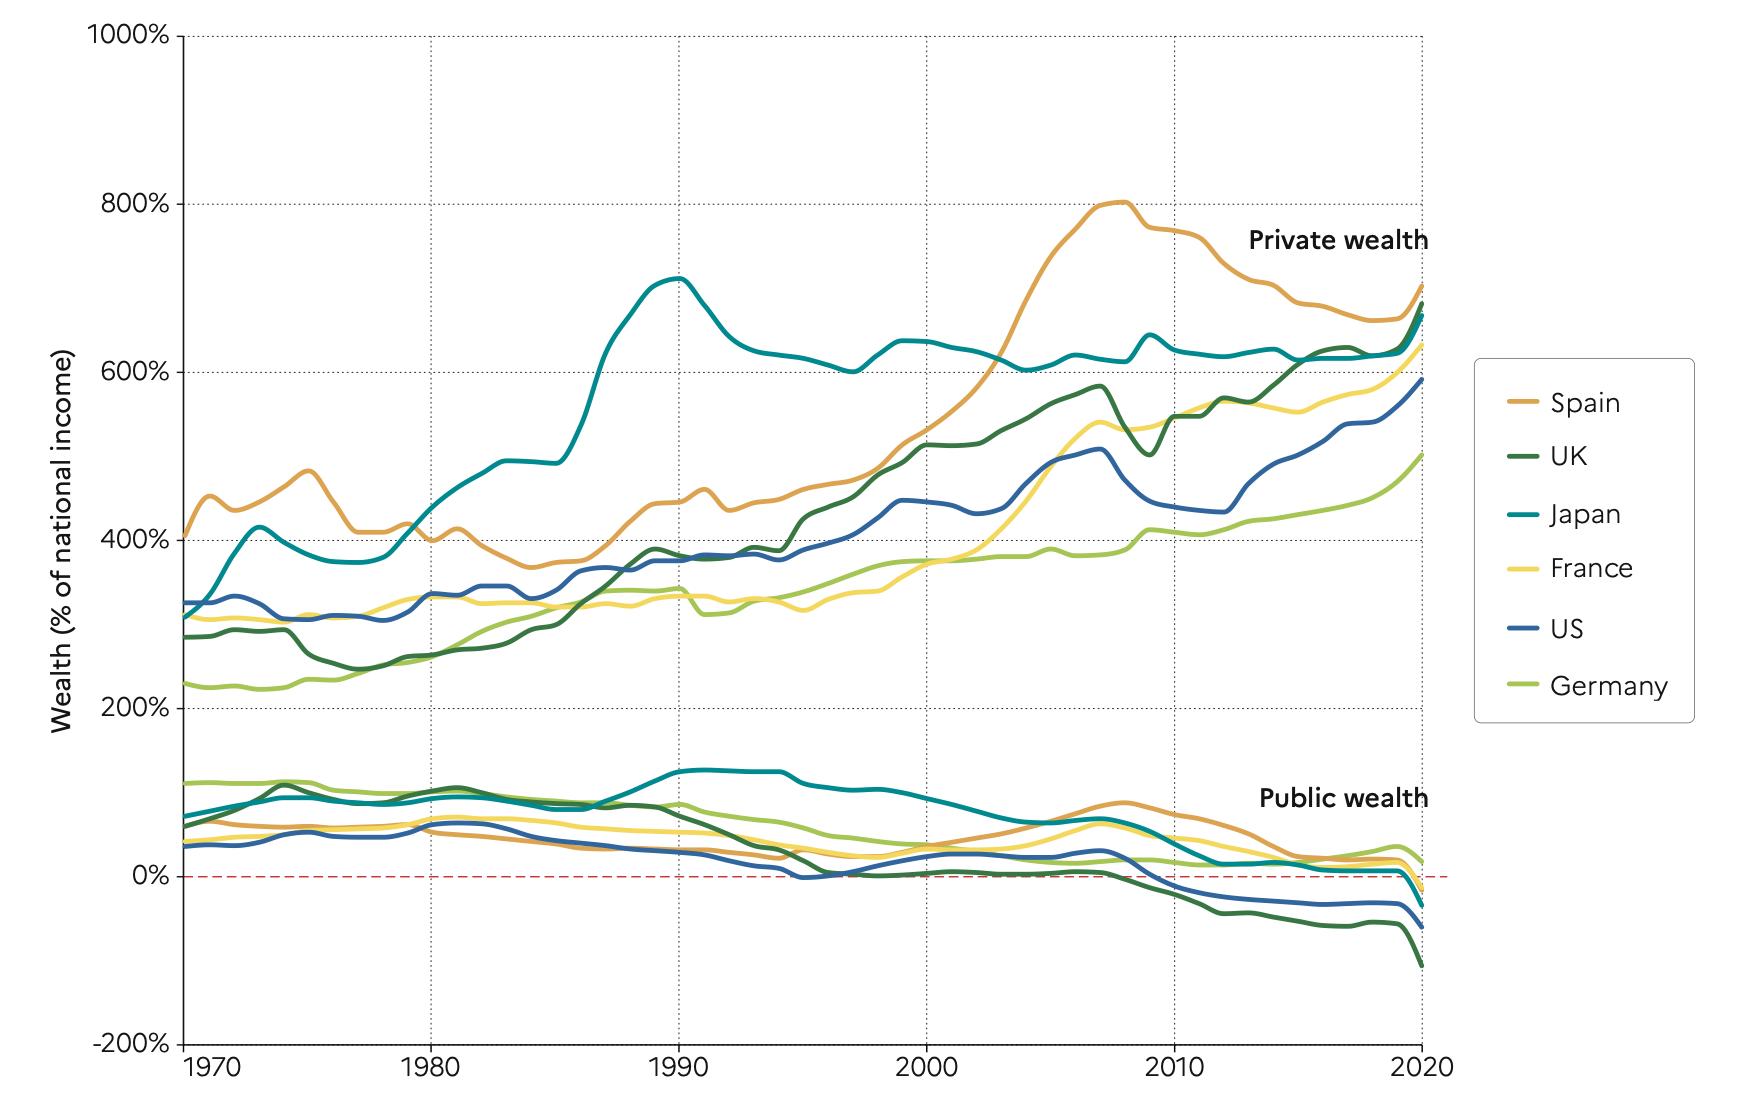
Private and public wealth

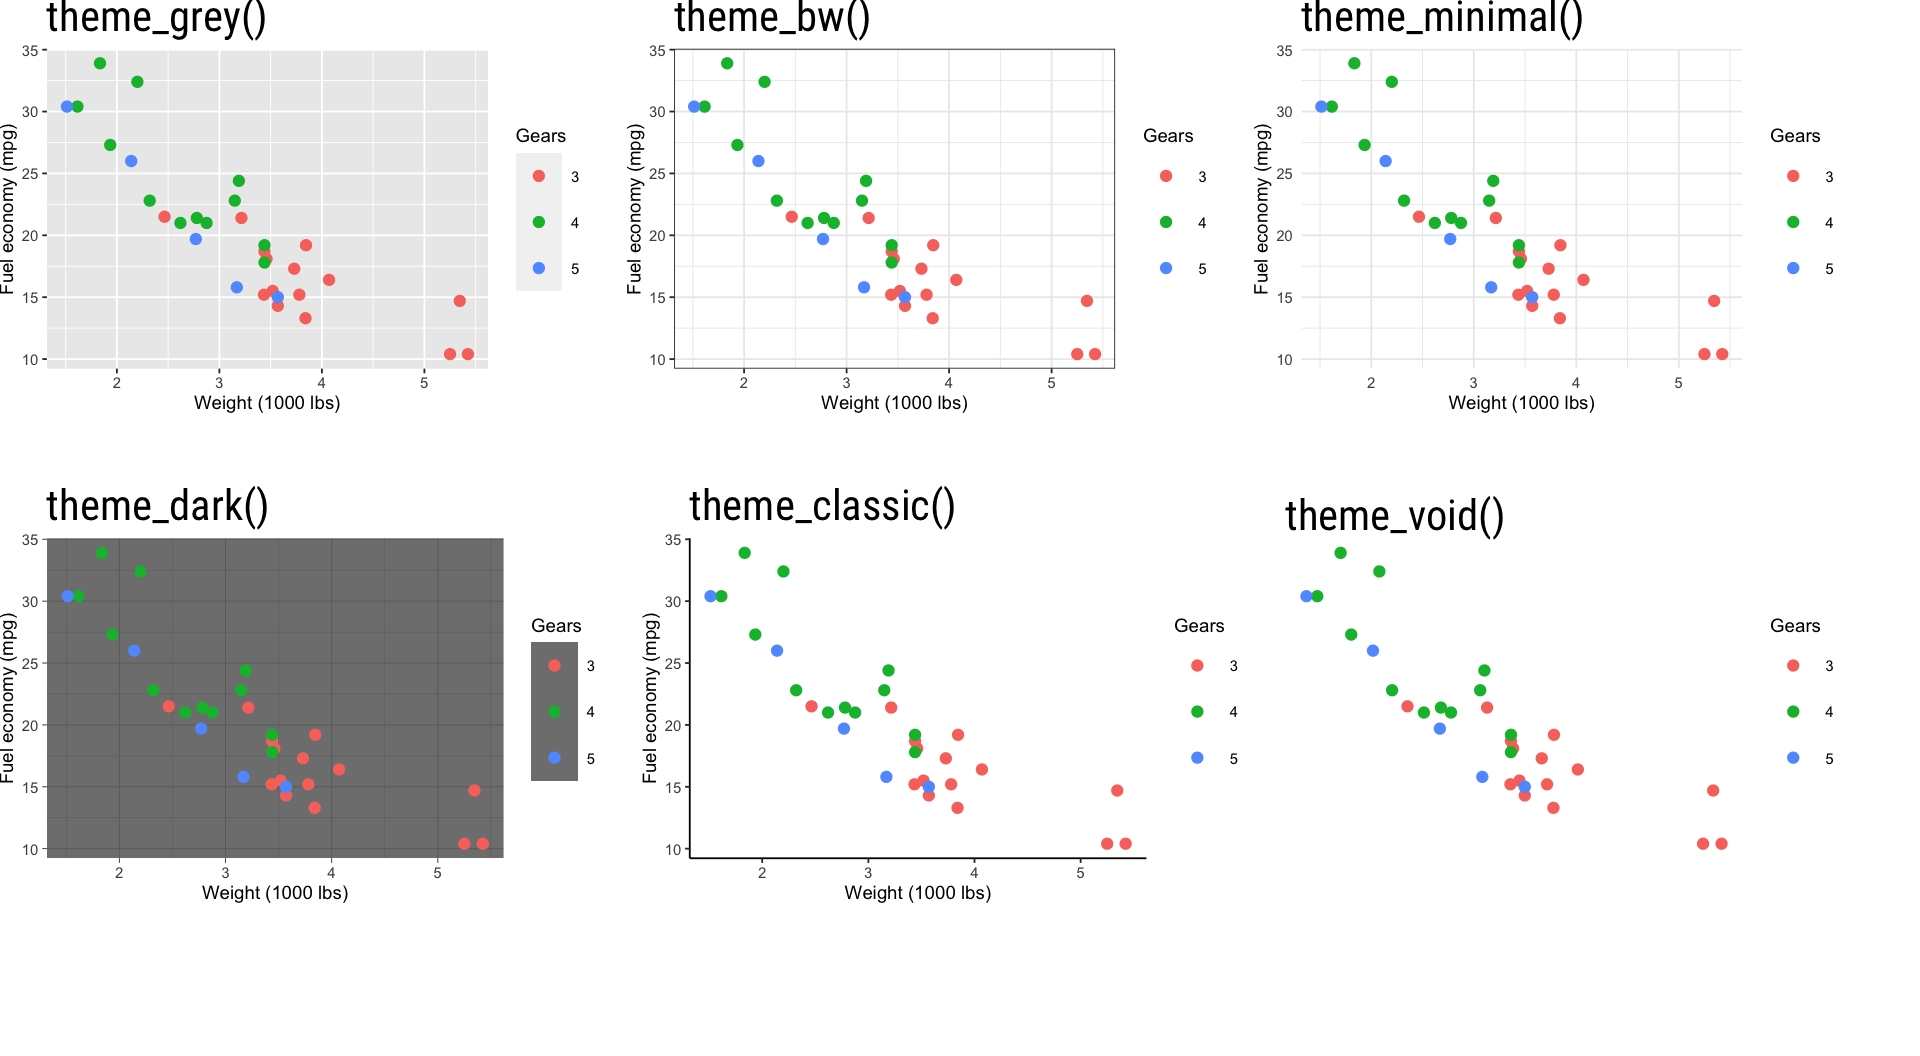
Themes

Themes

Main theme components

data |> ggplot(aes(x = var1, y = var2)) |>
  geom_line() +
  theme_minimal() +
  theme(plot.background = element_rect(fill = "red"),
        panel.grid.x = element_blank(),
        axis.line.x = element_line(linewidth = 1.2),
        legend.text = element_text(size = 7),
        legend.position = "top")


Plot Panel Axis Legend Strip
background background title background background
title border text key placement
subtitle grid ticks title text
caption spacing line text
margin position

Bibliography

Chancel, Lucas/Piketty, Thomas/Saez, Emmanuel/Zucman, Gabriel (2022). World inequality report 2022. World Inequality Lab.
Disslbacher, Franziska/Ertl, Michael/List, Emanuel/Mokre, Patrick/Schnetzer, Matthias (2020). On top of the top - adjusting wealth distributions using national rich lists (Working Paper Series No. 20). INEQ.
Gabaix, Xavier (2016). Power laws in economics: An introduction. Journal of Economic Perspectives, 30(1), 185โ€“206. DOI: 10.1257/jep.30.1.185
Kennickell, Arthur B./Woodburn, R. Louise (1999). Consistent weight design for the 1989, 1992 and 1995 SCFs, and the distribution of wealth. Review of Income and Wealth, 45(2), 193โ€“215. DOI: 10.1111/j.1475-4991.1999.tb00328.x
OECD (2013). OECD guidelines for micro statistics on household wealth. OECD. DOI: 10.1787/9789264194878-en
Vermeulen, Philip (2016). Estimating the top tail of the wealth distribution. The American Economic Review, 106(5), 646โ€“650. DOI: 10.1257/aer.p20161021