Economic Policy Visualization
Income · Scales
May 8, 2023
Income inequality in economic policy
- UN SDG 10.1: “By 2030, progressively achieve and sustain income growth of the bottom 40 per cent of the population at a rate higher than the national average.”
- Economists focus on the economic origins and implications of inequality rather than the social and ecological context.
- In neoclassical economics, income inequality arises from differences in marginal productivity and might stimulate economic growth due to differential savings rates, investment, and incentives for effort (Josifidis/Supic, 2018).
- In (Post-)Keynesian economics, income inequality is the result of institutional settings, power relations, etc. Inequality harms economic growth in most of these models due to detrimental effects on aggregate demand (Kurz/Salvadori, 2010).
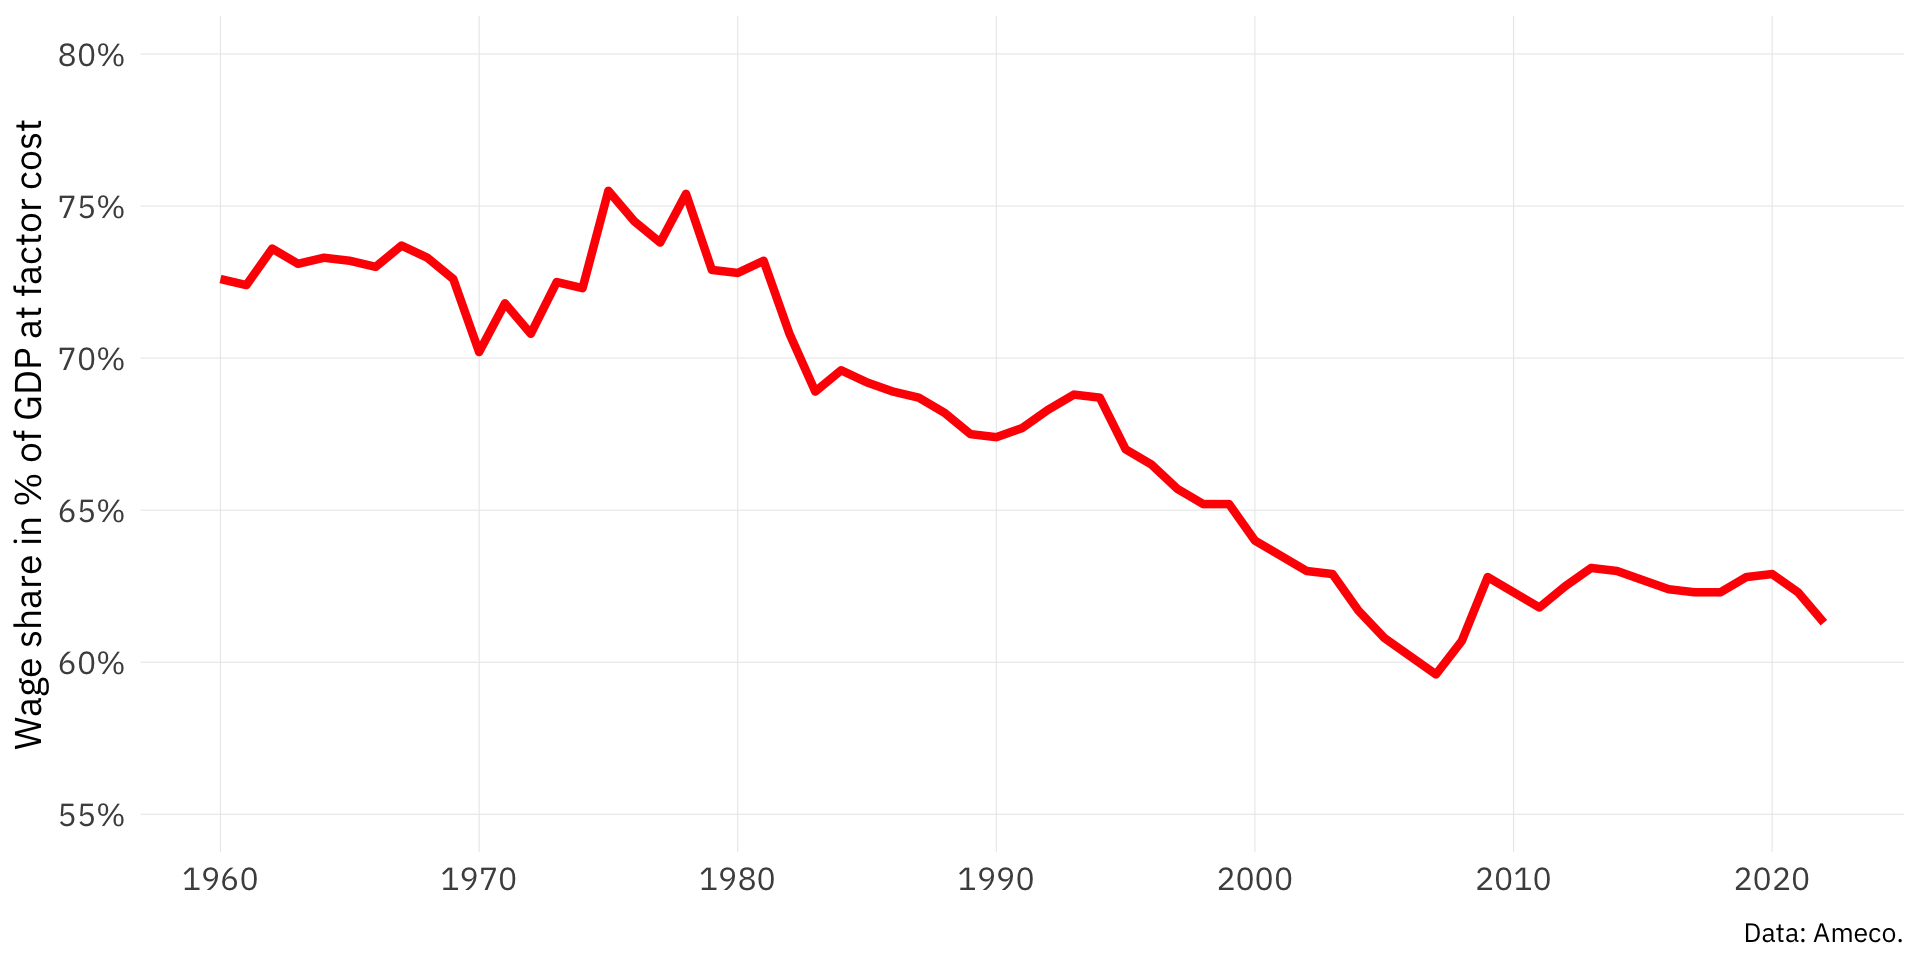
The wage share in Austria
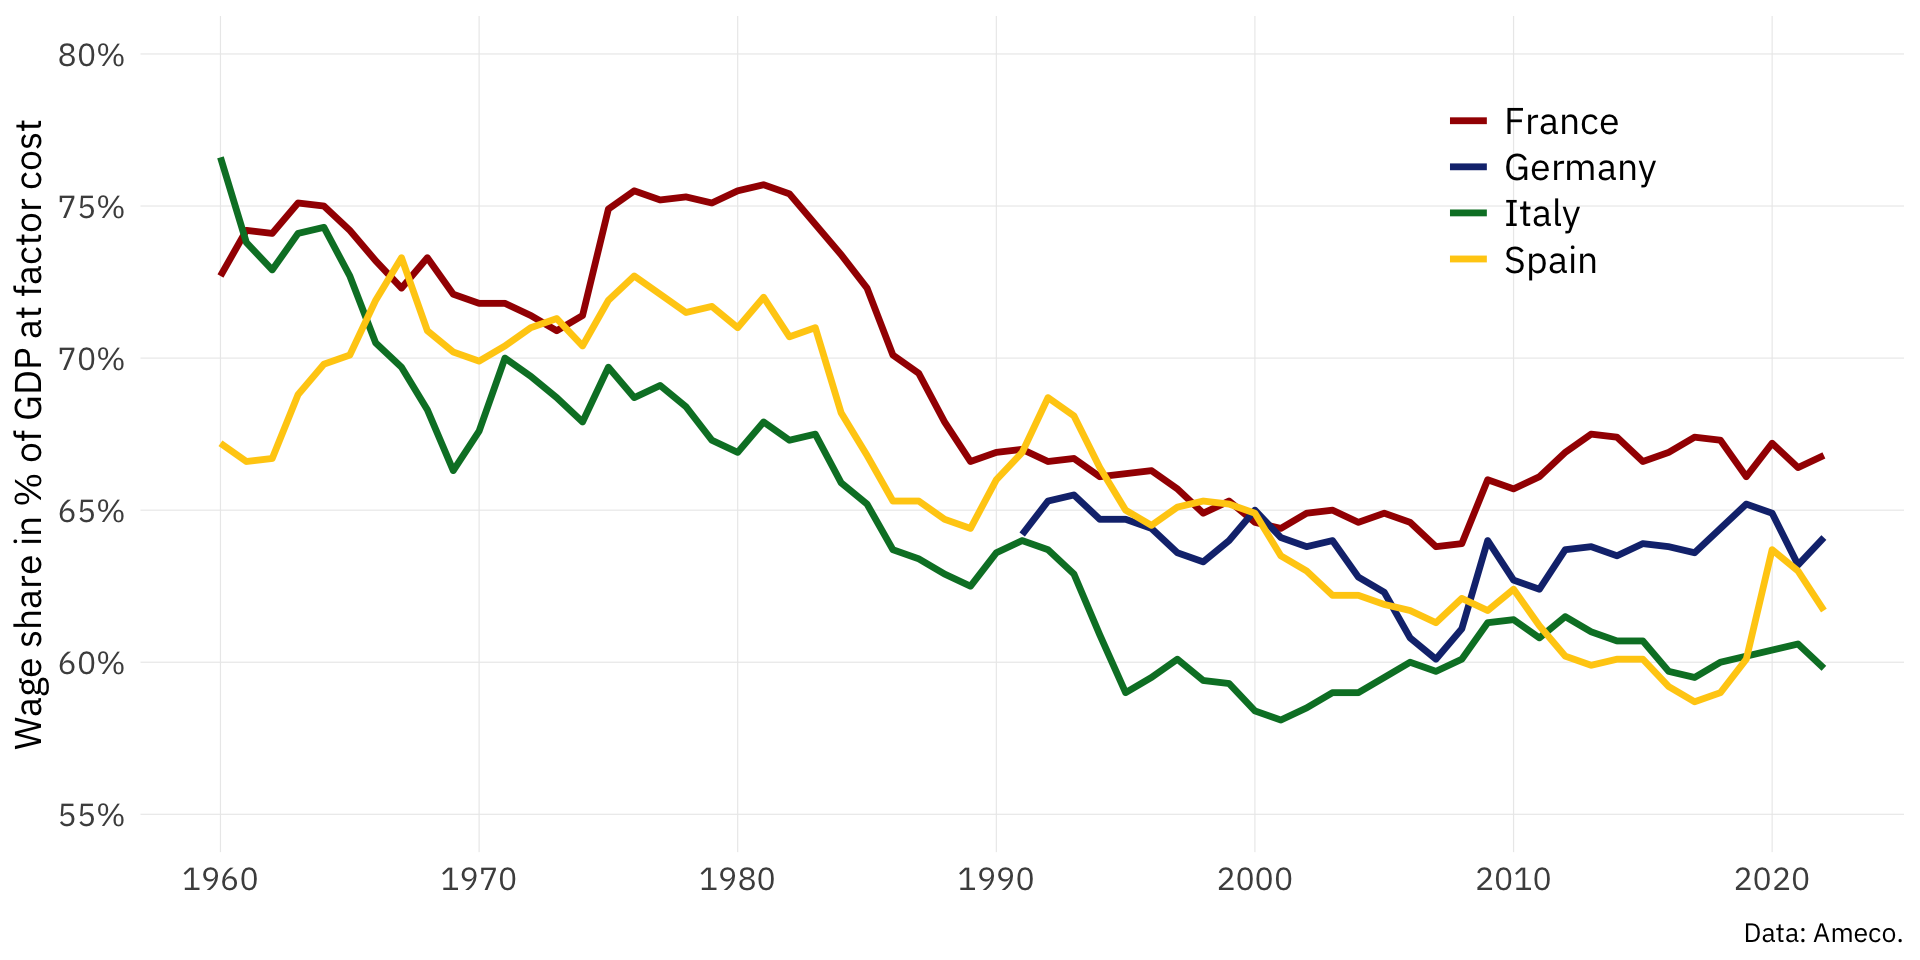
Functional income distribution in Continental Europe
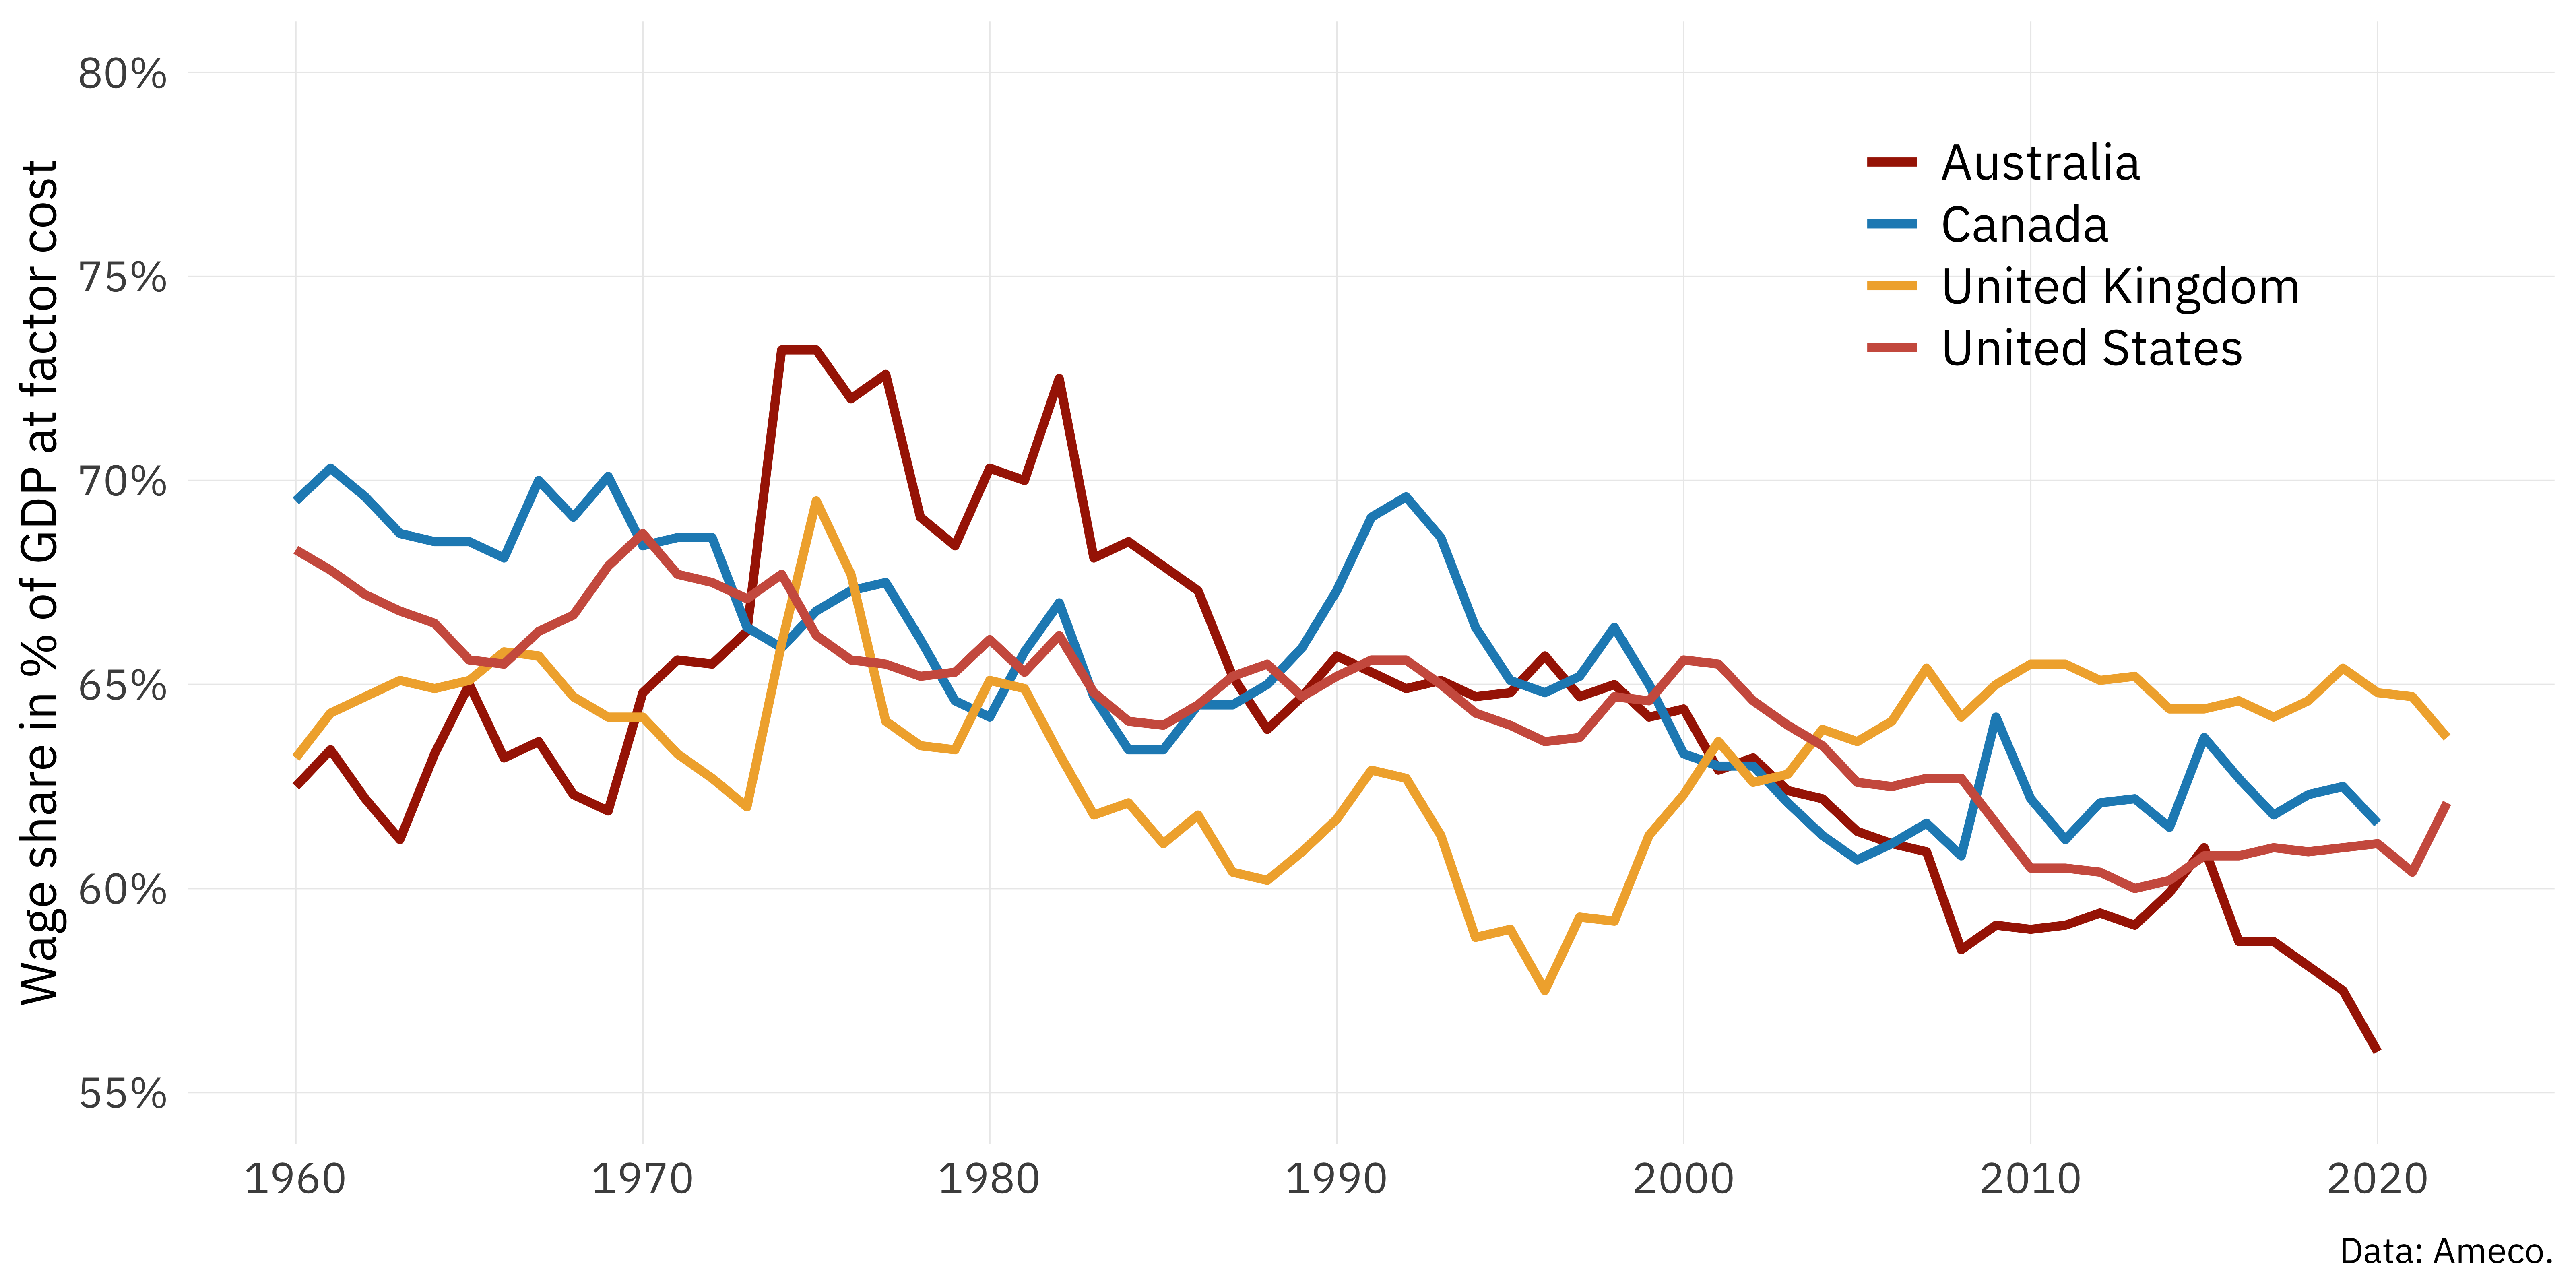
Functional distribution in Anglosaxon countries
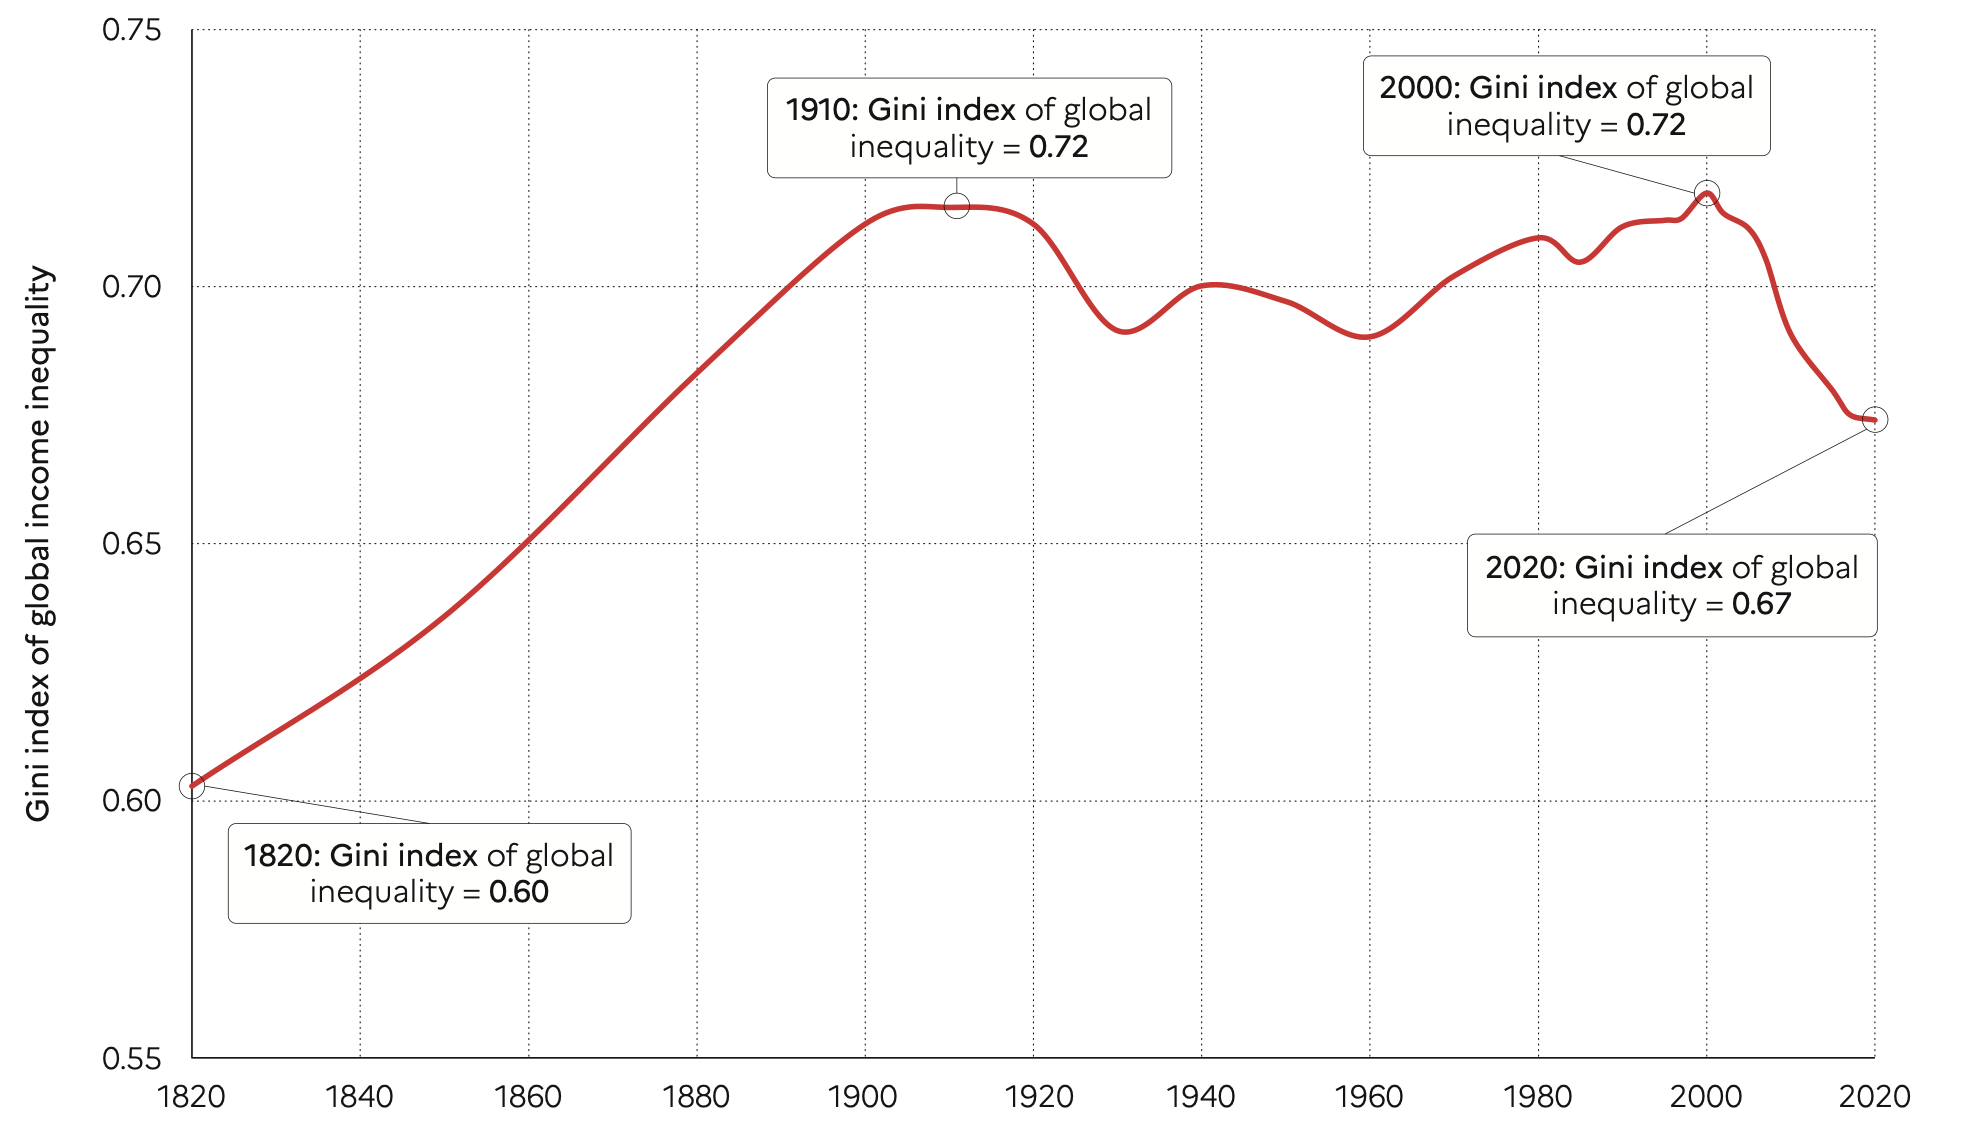
Historical development of global personal inequality: 3 views


Global inequality 1820-2020
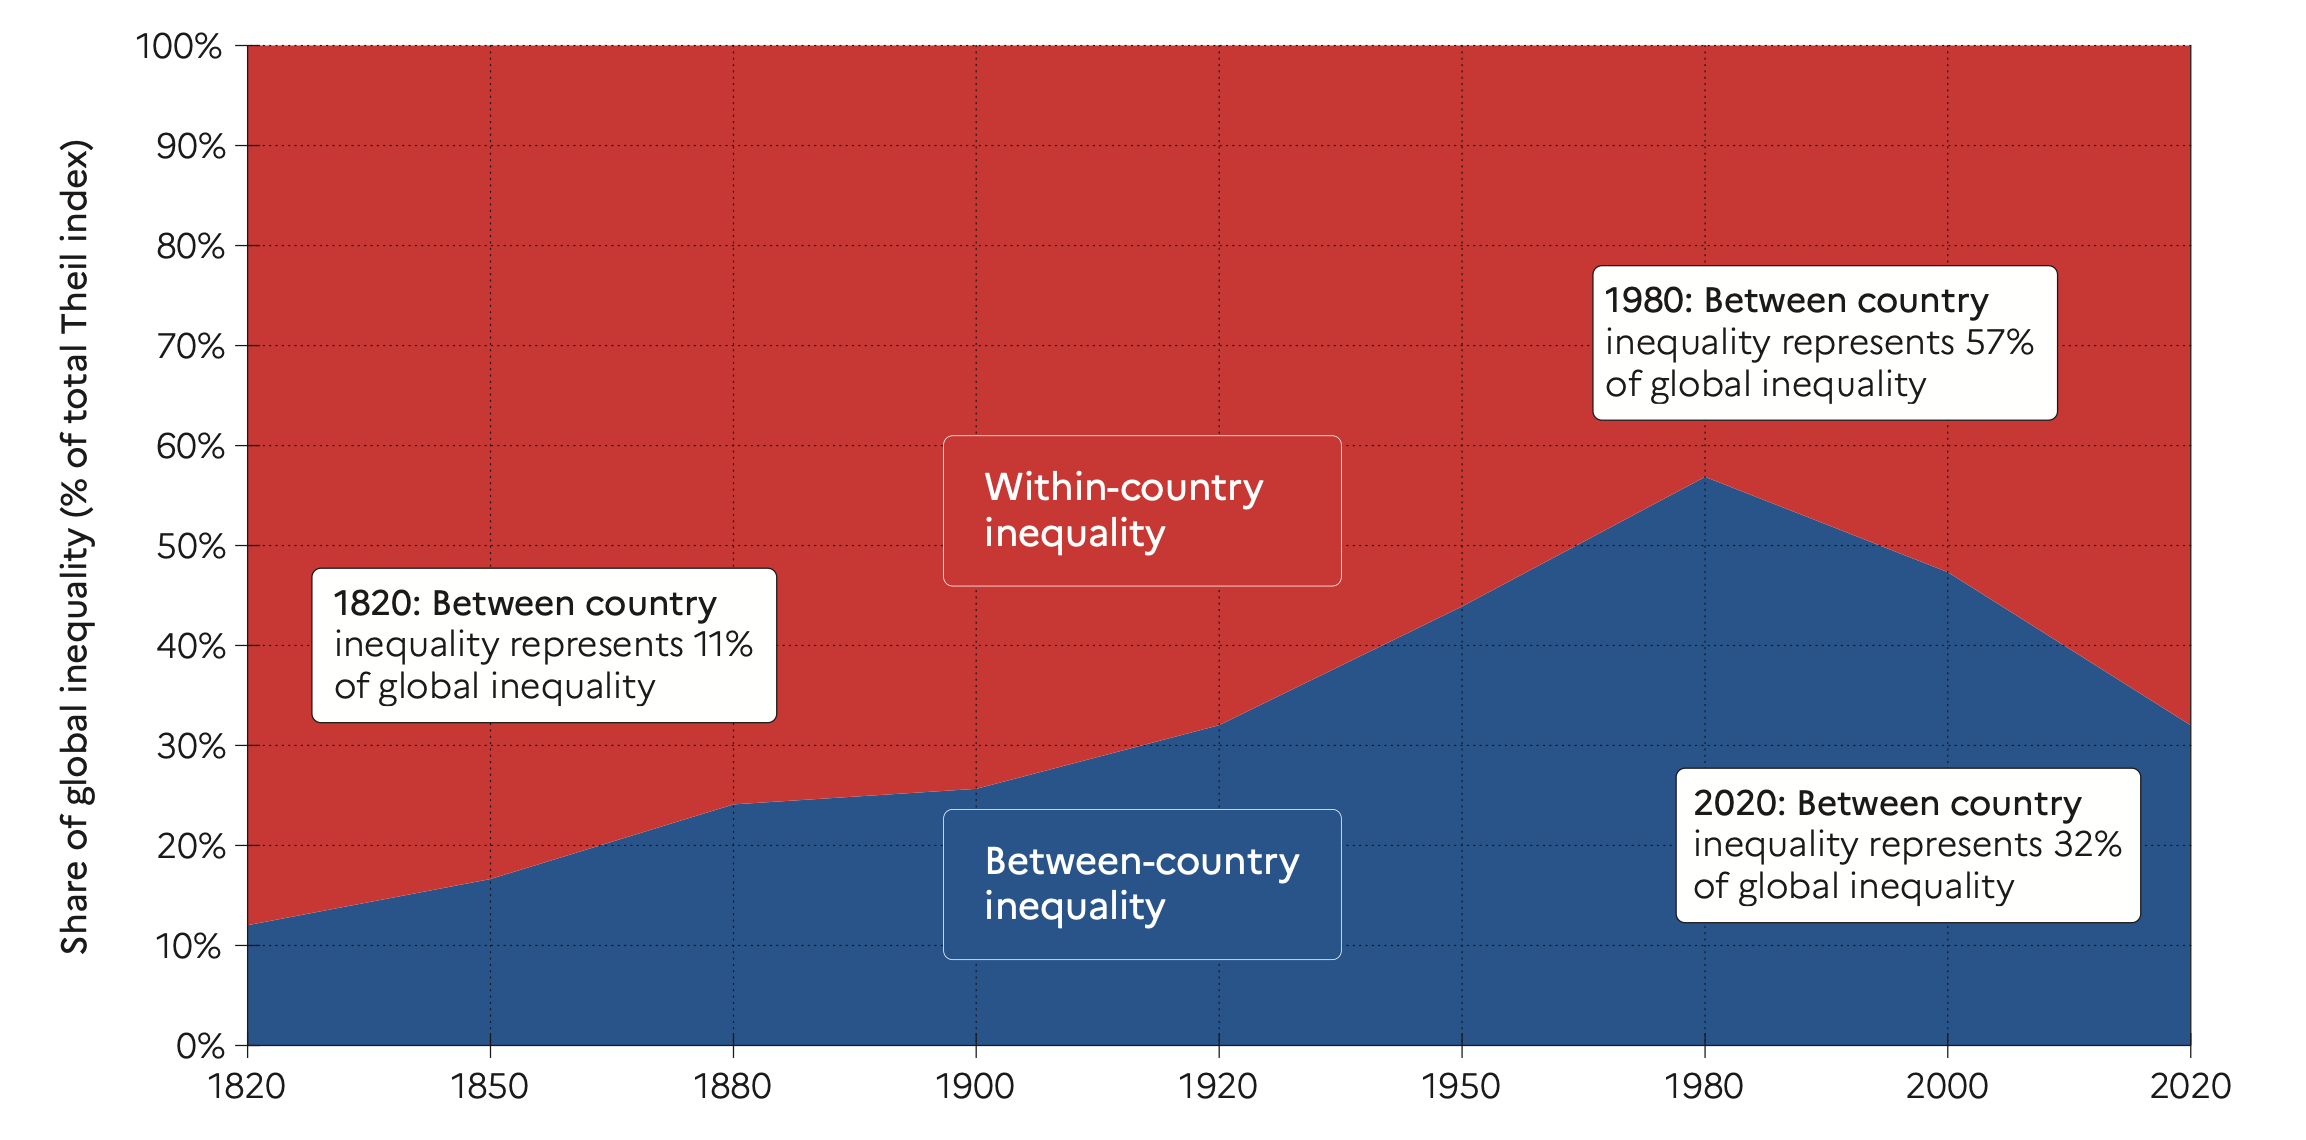
Decomposition of global inequality
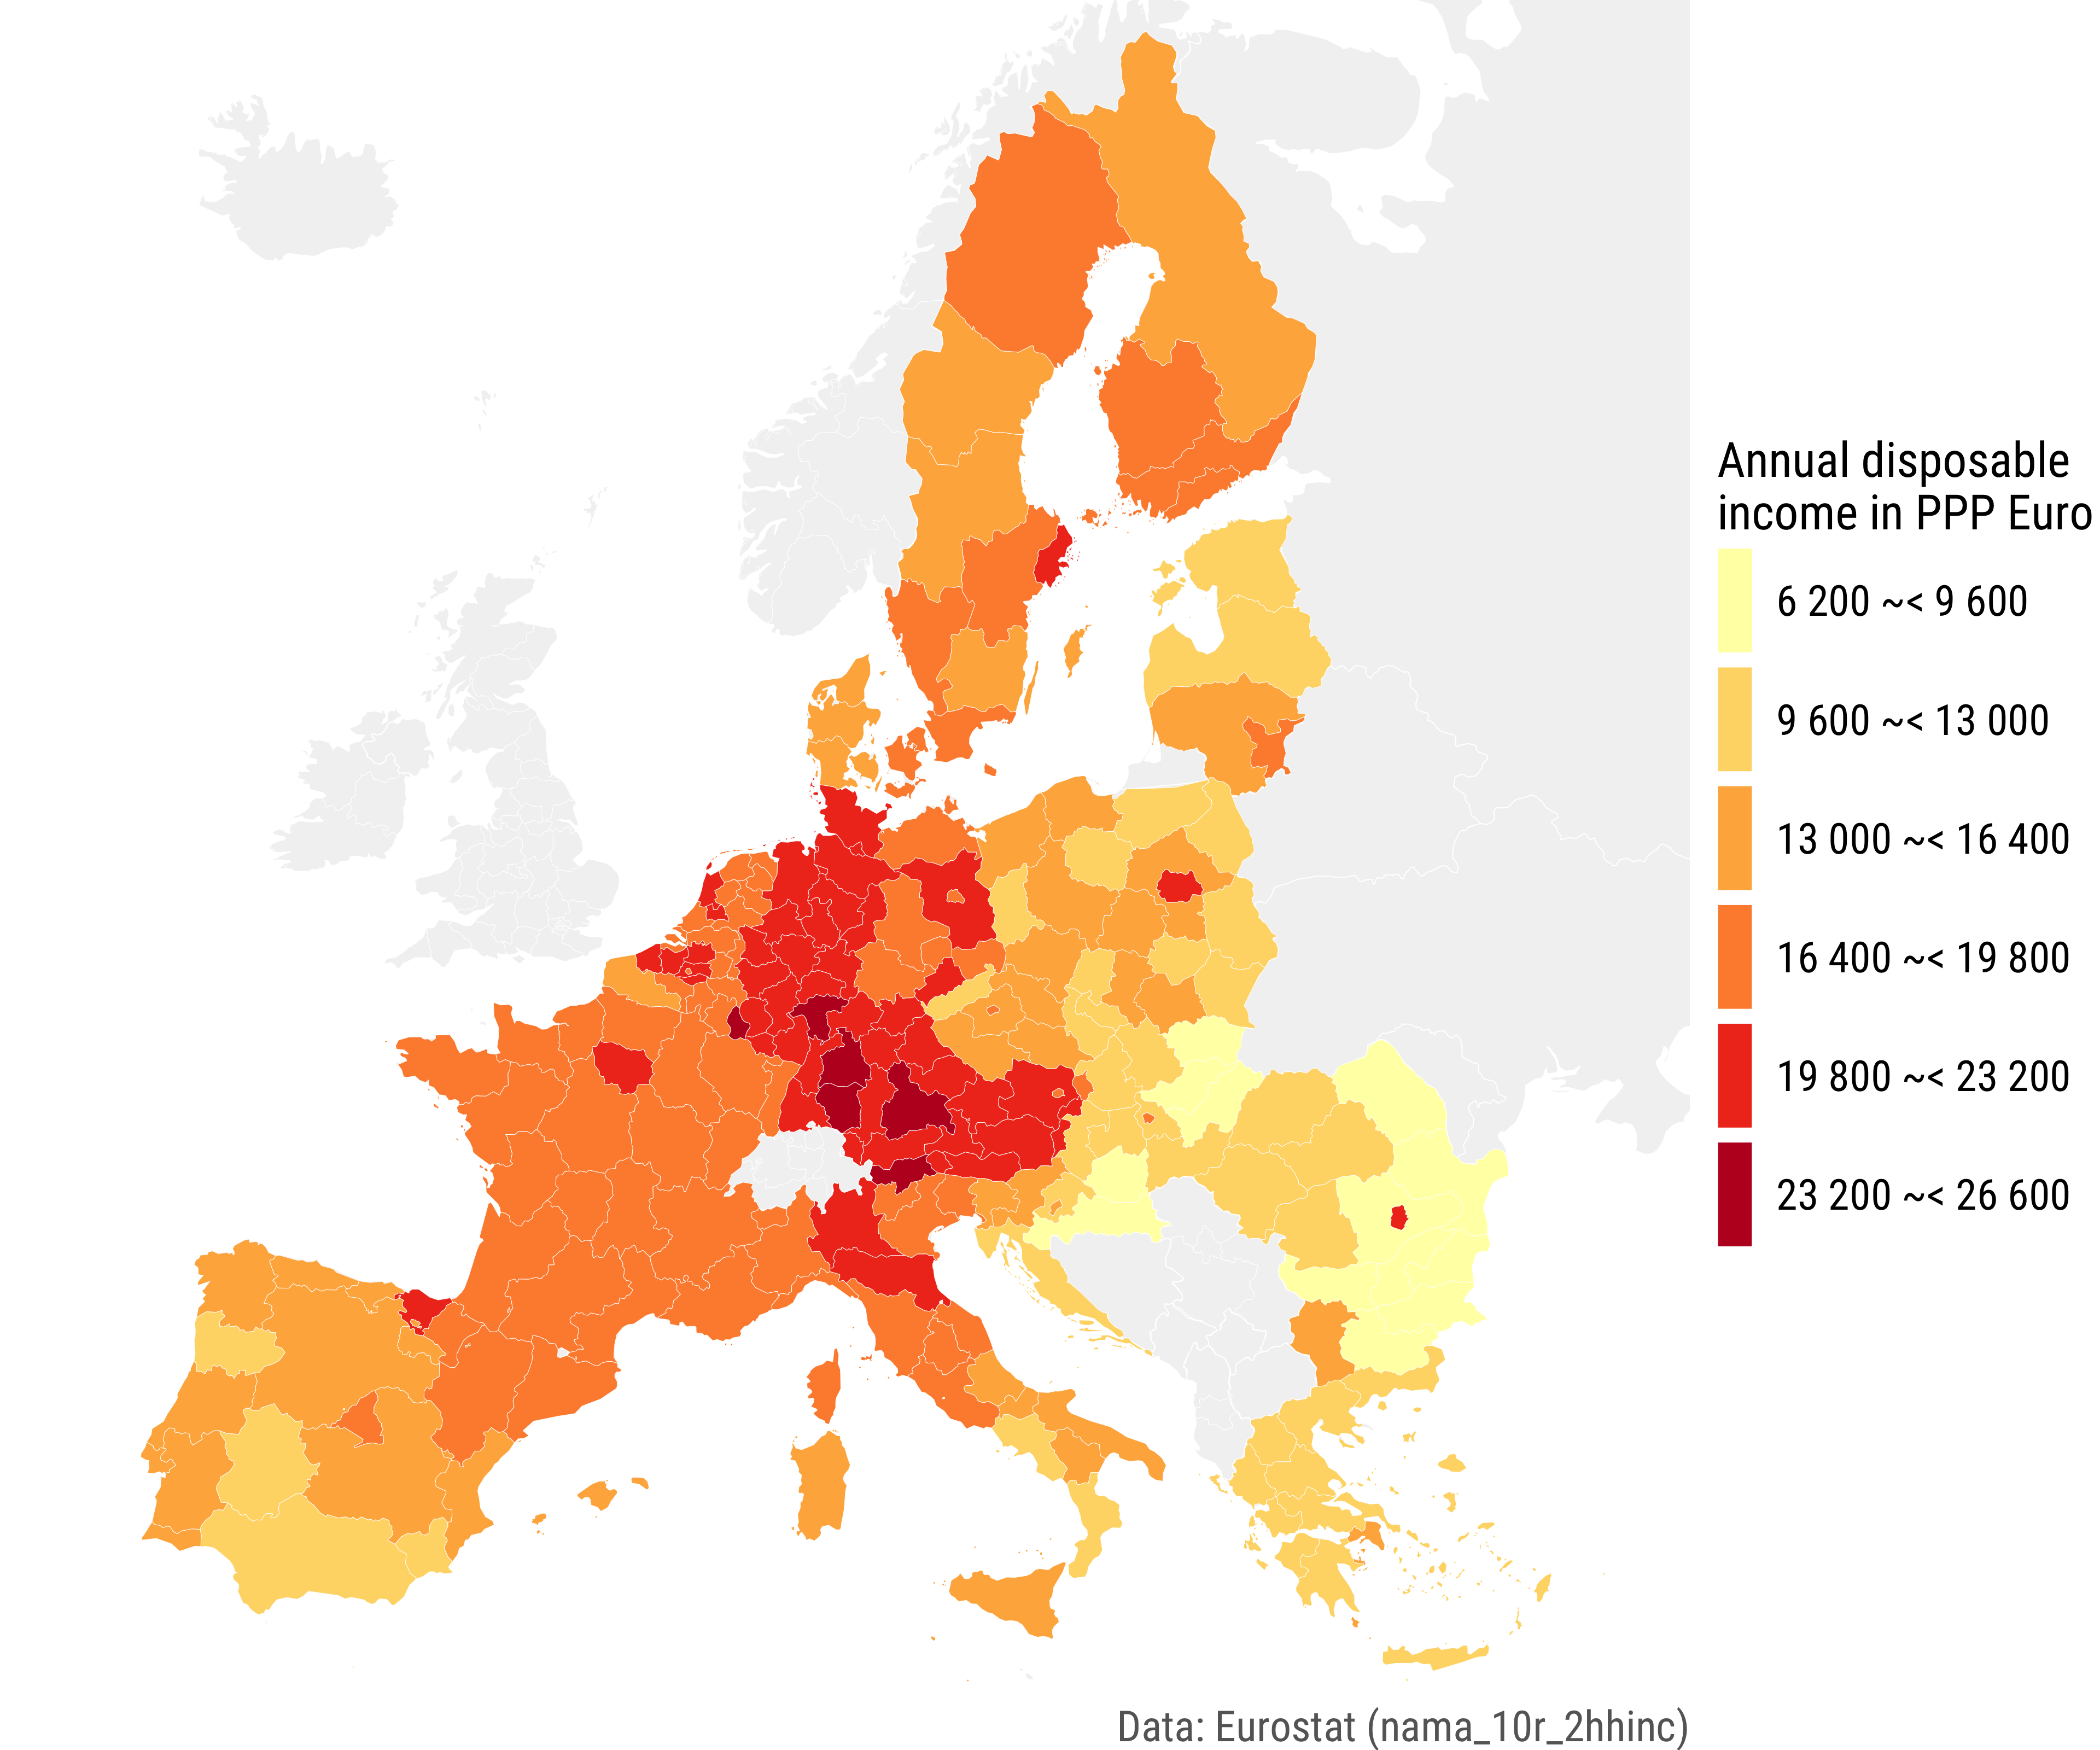
Disposable net income in Europe
Scales
![]()
Shape, size and alpha
tribble(~x, ~y, ~significance, ~gdp, ~continent,
        0.5, 0.5, "yes", 140, "Asia",
        1.0, 0.5, "yes", 100, "Africa",
        1.5, 0.5, "no",  250, "Europe") |>
  ggplot(aes(x = x, y = y)) +
  geom_point(aes(alpha = significance, size = gdp, shape = continent)) +
  scale_alpha_discrete(range = c(0.5, 1), guide = guide_none()) +
  scale_size_continuous(range = c(5, 12), guide = guide_none()) +
  scale_shape_manual(values = c(17, 19, 15),
                     guide = guide_legend(title = "Continent",
                                          override.aes = list(size = 5))) +
  theme_minimal()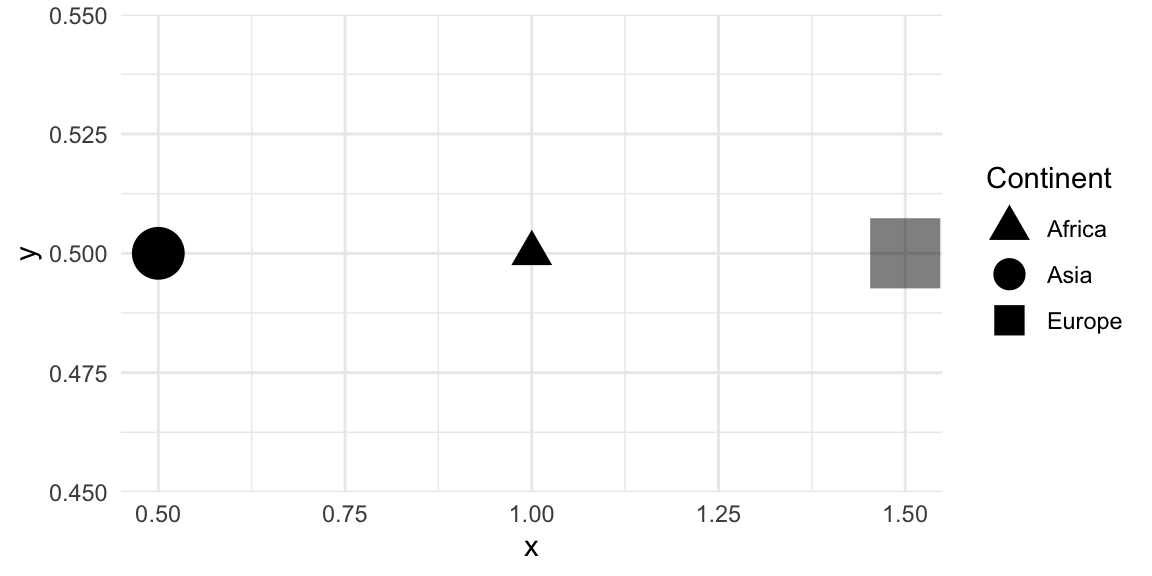
Bibliography
![]()
Chancel, Lucas/Piketty, Thomas/Saez, Emmanuel/Zucman, Gabriel (2022). World inequality report 2022. World Inequality Lab.
Josifidis, Kosta/Supic, Novica (2018). Institutionalist versus neoclassical view on income distribution and economic progress: The OECD panel evidence. Panoeconomicus, 65(3), 319–337. DOI: 10.2298/pan1803319j
Kurz, Heinz D./Salvadori, Neri (2010). The post-keynesian theories of growth and distribution: A survey. In Setterfield, Mark (Ed.), Handbook of alternative theories of economic growth. Edward Elgar Publishing. DOI: 10.4337/9781849805582.00010
Stockhammer, Engelbert (2015). Determinants of the wage share: A panel analysis of advanced and developing economies. British Journal of Industrial Relations, 55(1), 3–33. DOI: 10.1111/bjir.12165