Economic Policy Visualization
Inflation · Colors
April 17, 2023
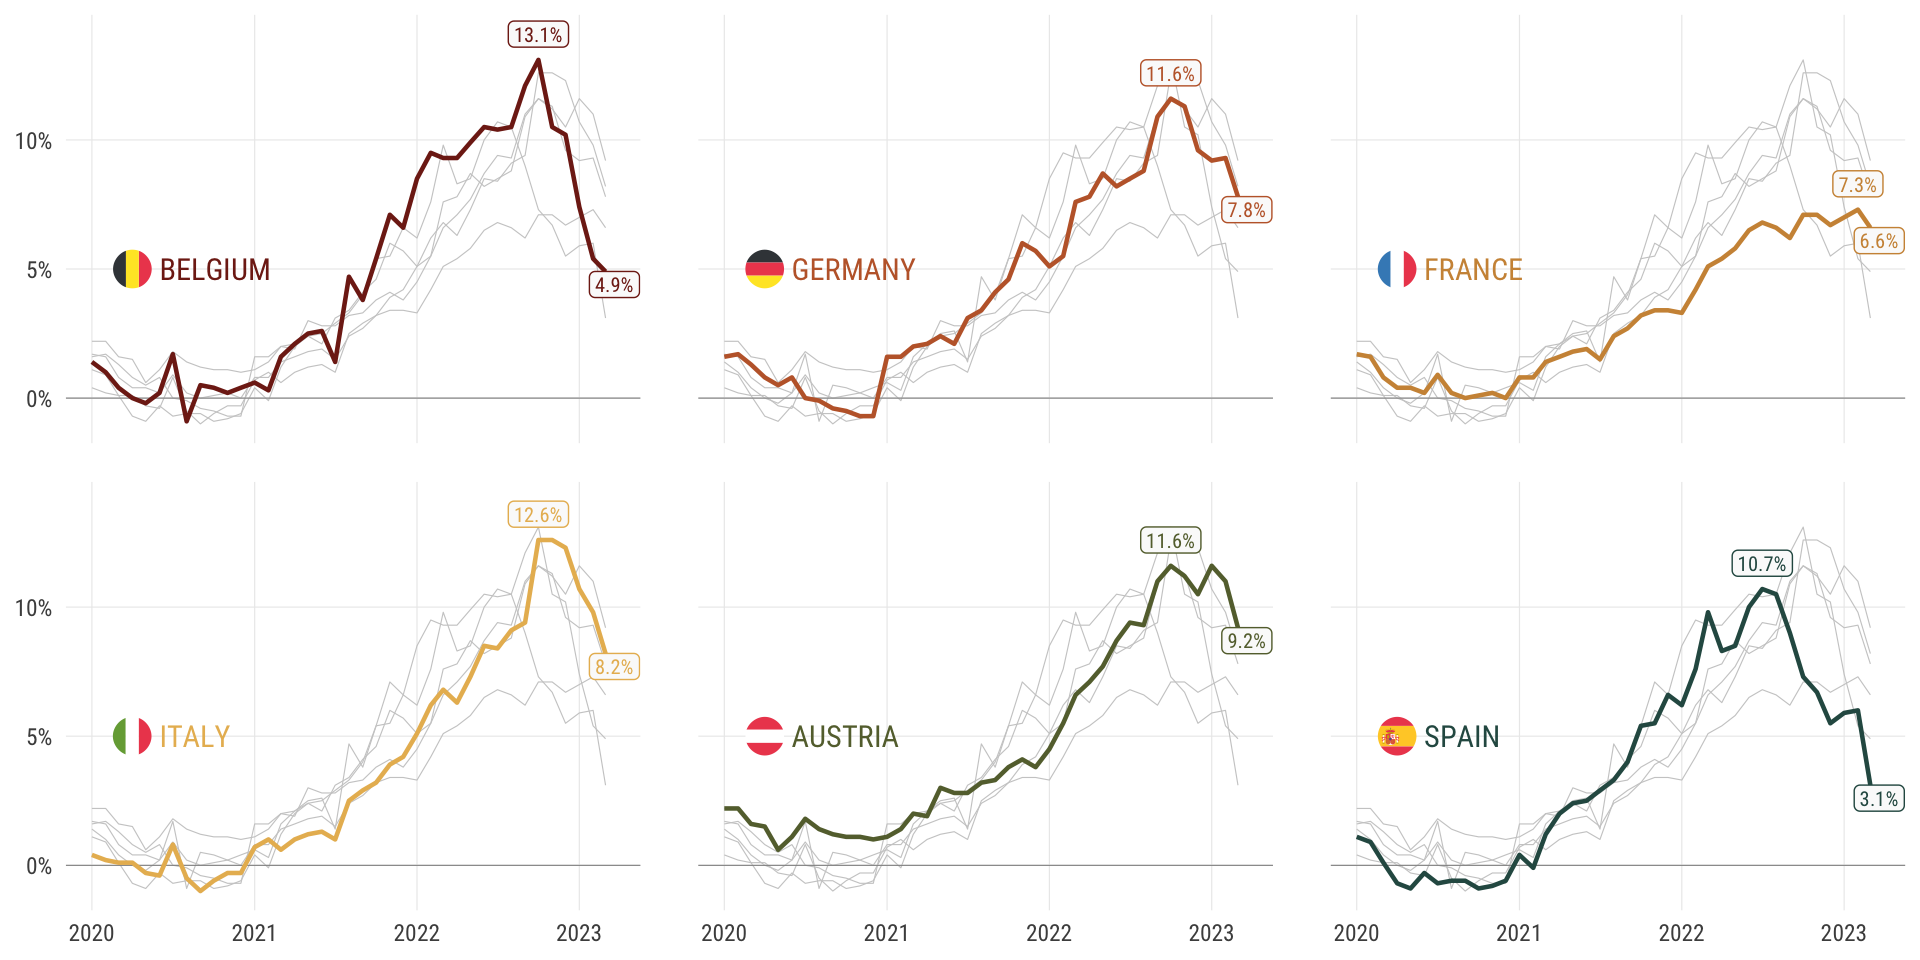
Conflicting economic policy goals: Inflation and unemployment
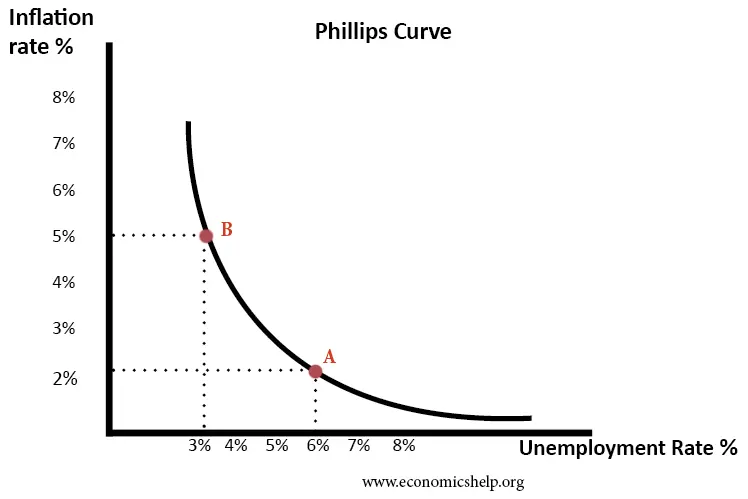
A longstanding discussion in economic policy revolves around the (negative) relationship between inflation and unemployment. This has been expressed in the Phillips curve.
Keynesian view
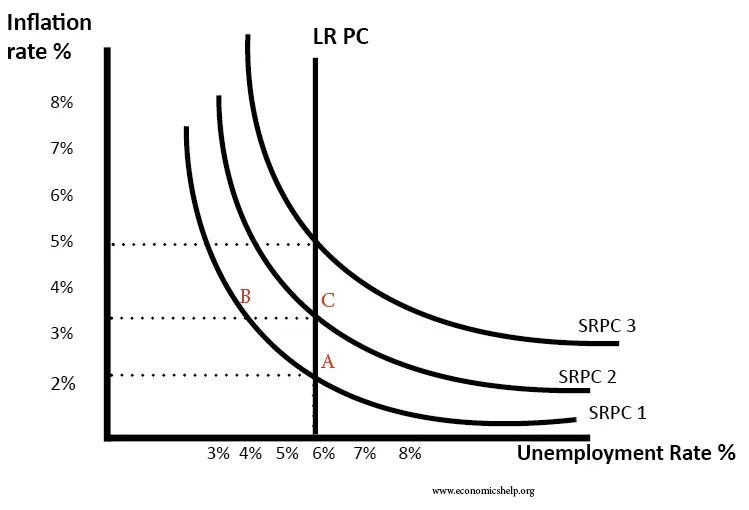
Monetarist view
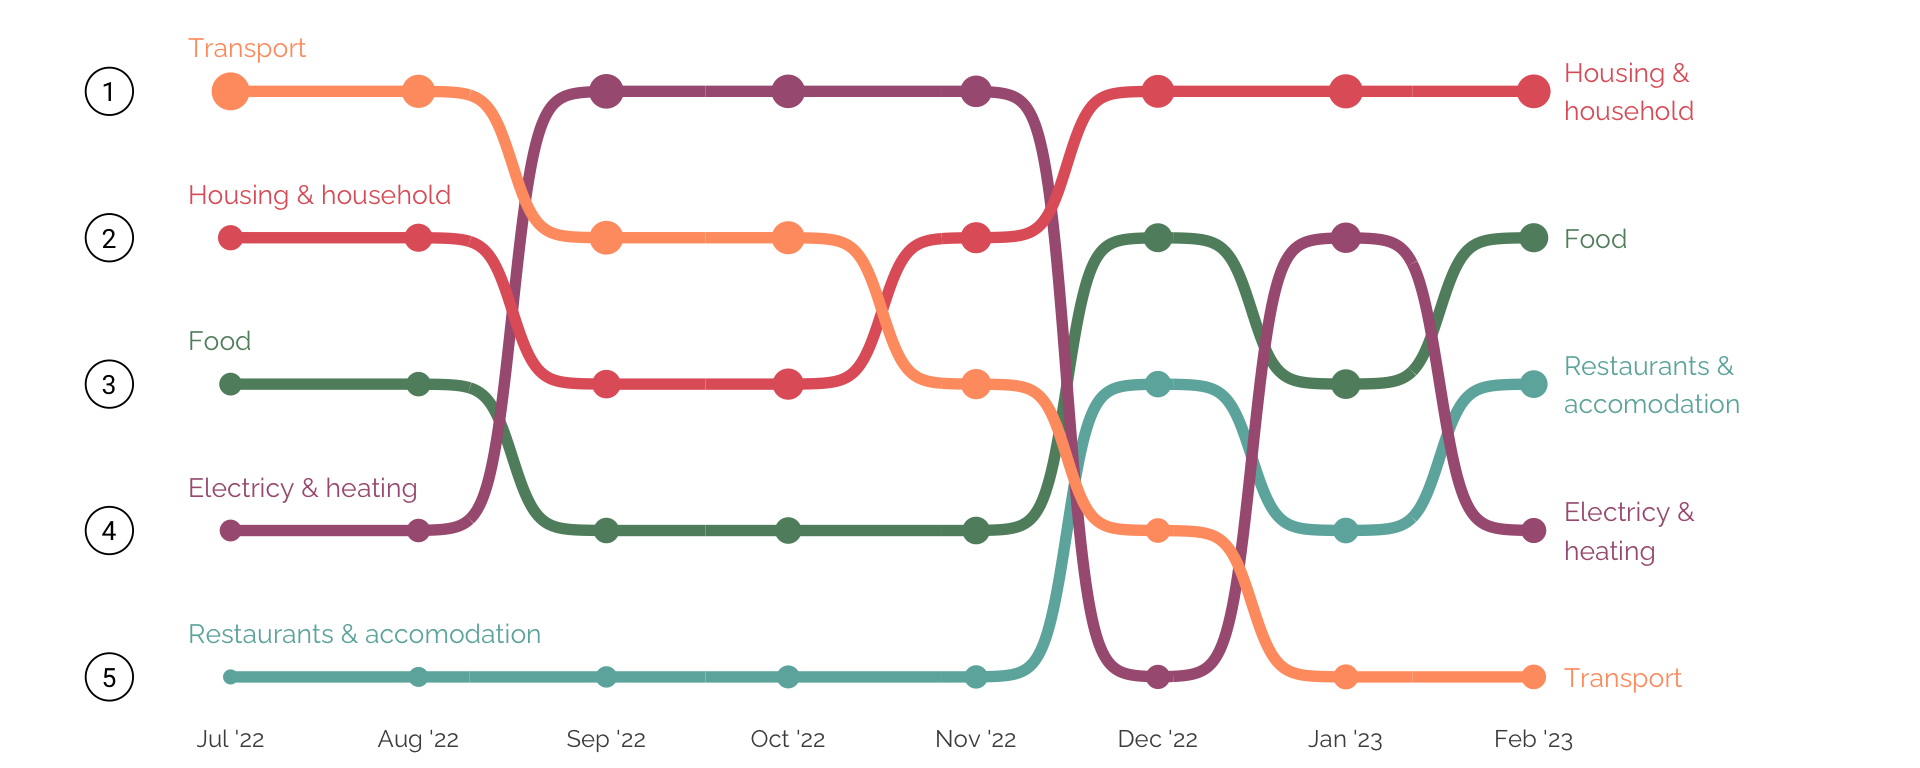
Inflation in Austria by selected COICOP groups
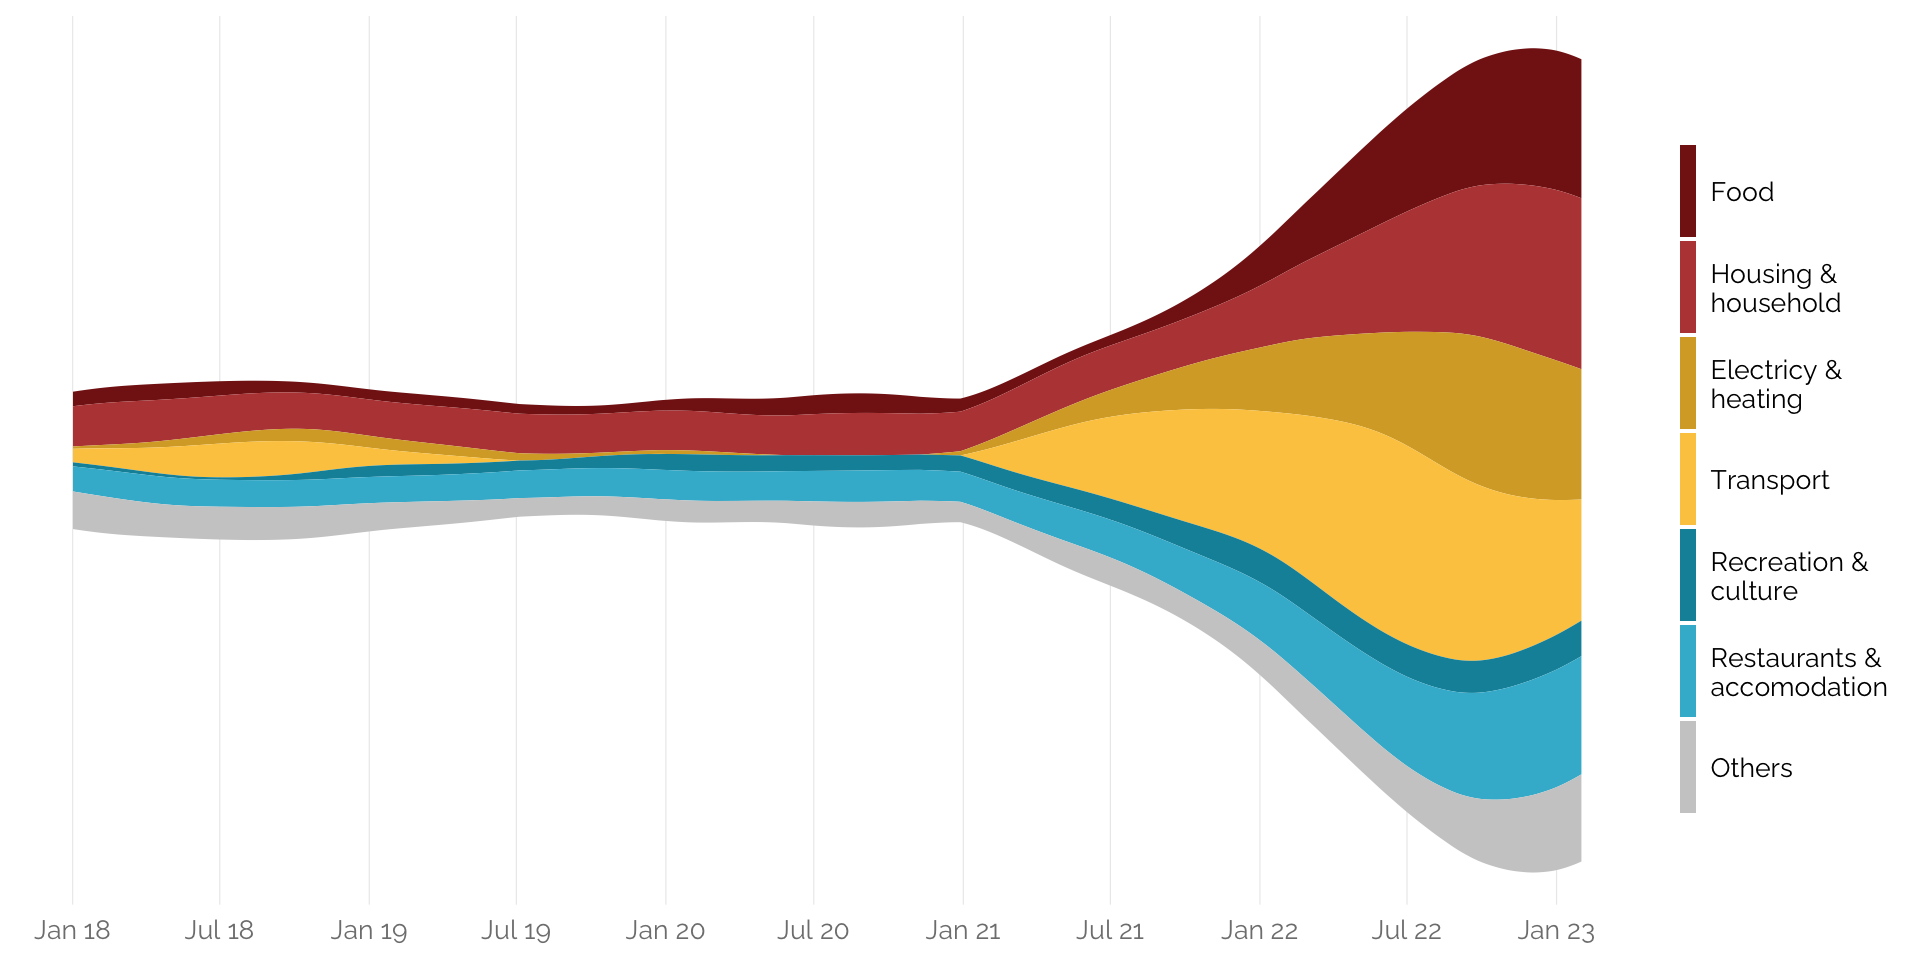
Drivers of inflation in Austria
All colours are beautiful
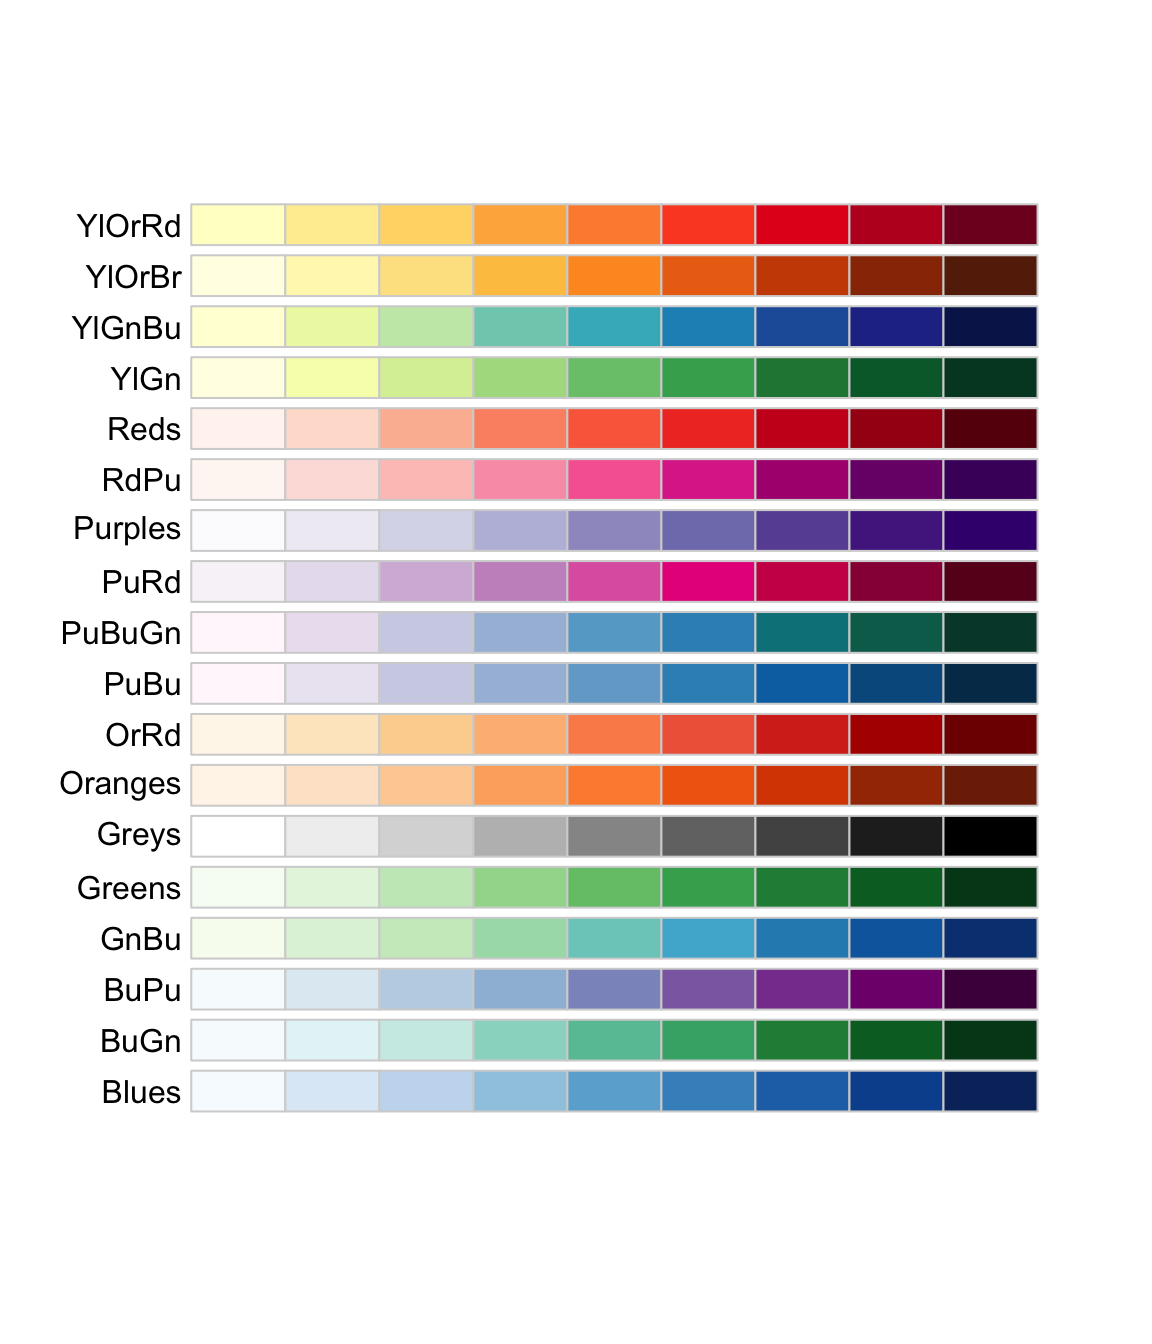
Color palettes of {RColorBrewer}
Sequential
Use to encode numerical information with order
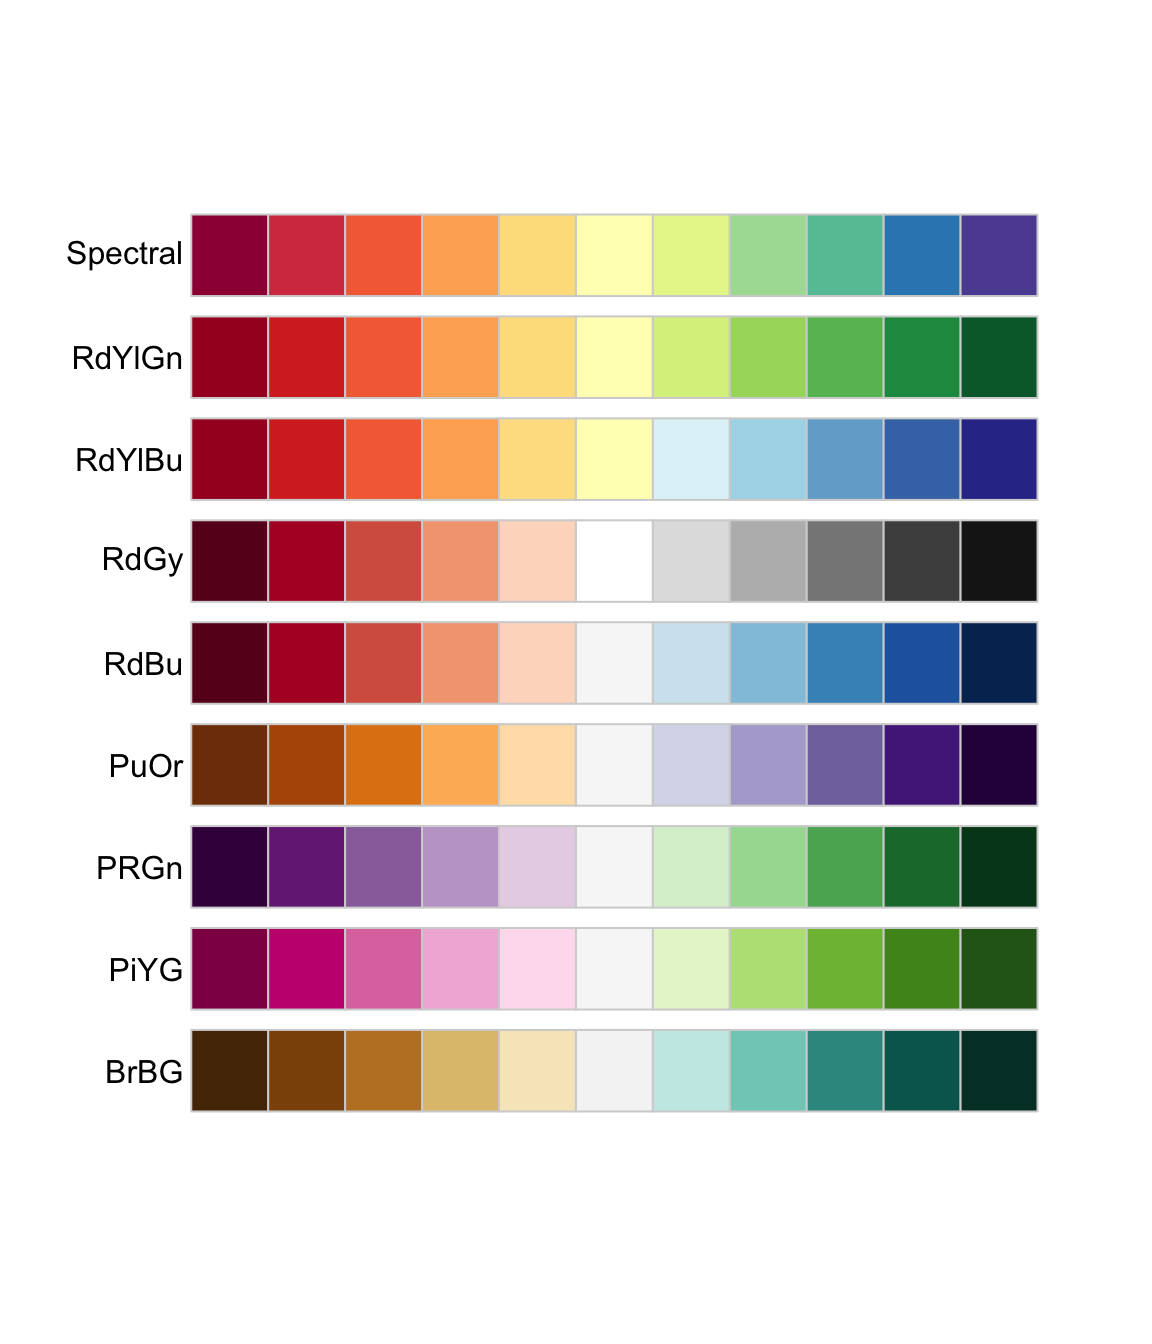
Diverging
Use to encode numerical information with critical midpoint
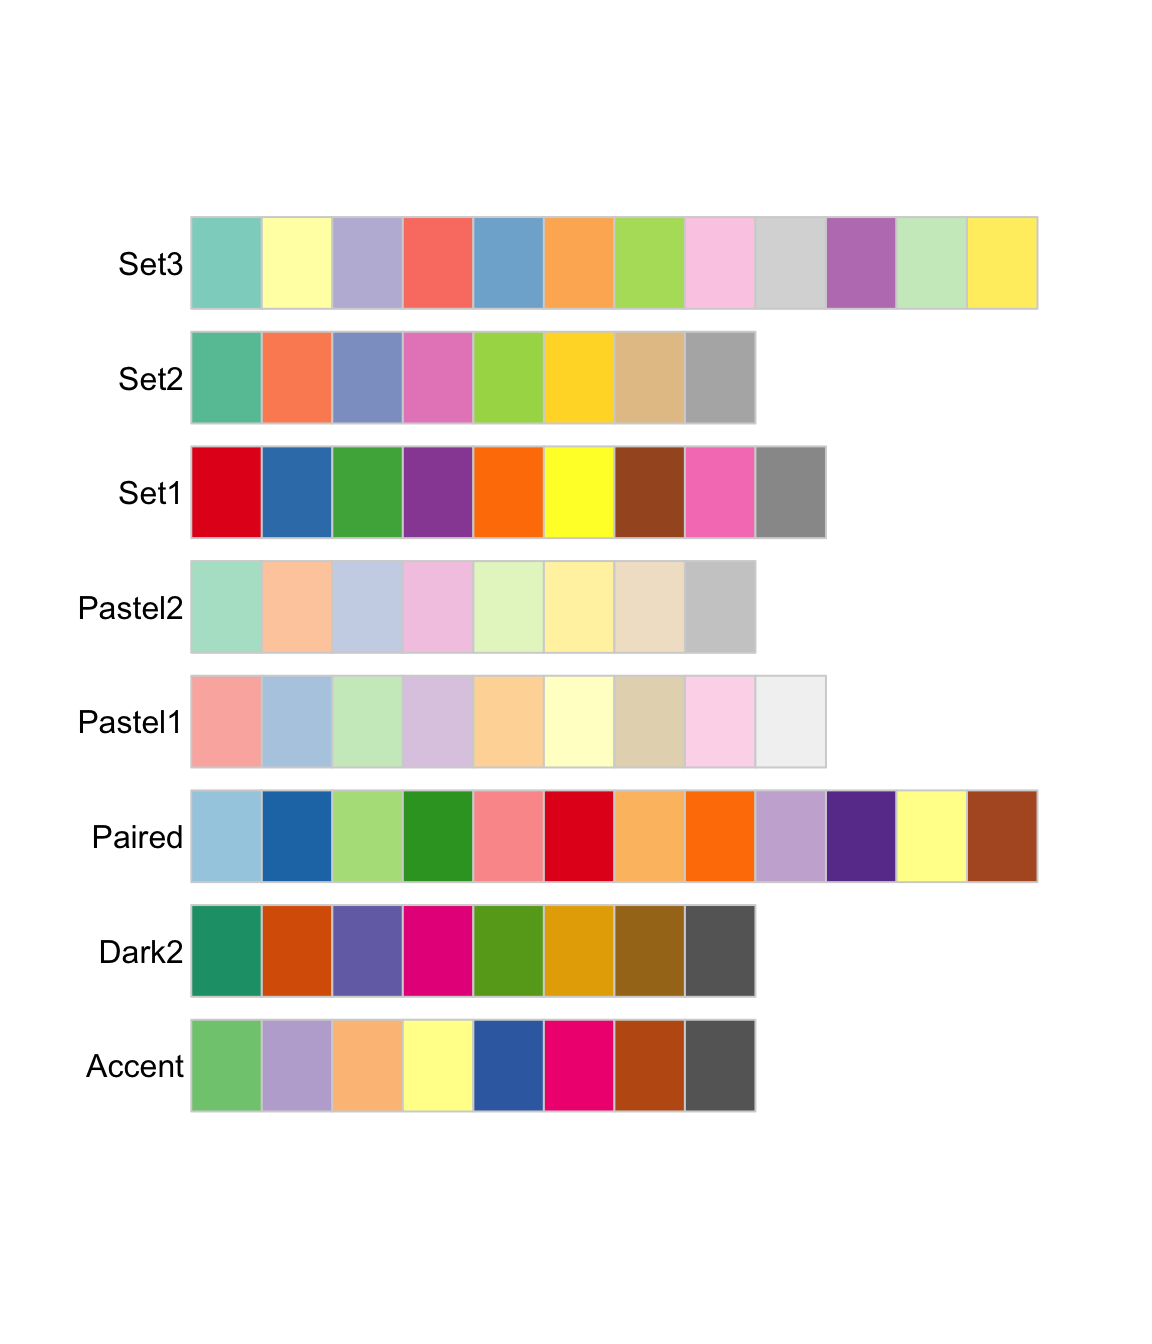
Qualitative
Use to encode categorical information
Color blindness
You may check whether the color scale works for people who can distinguish fewer colours than others with {colorBlindness}.
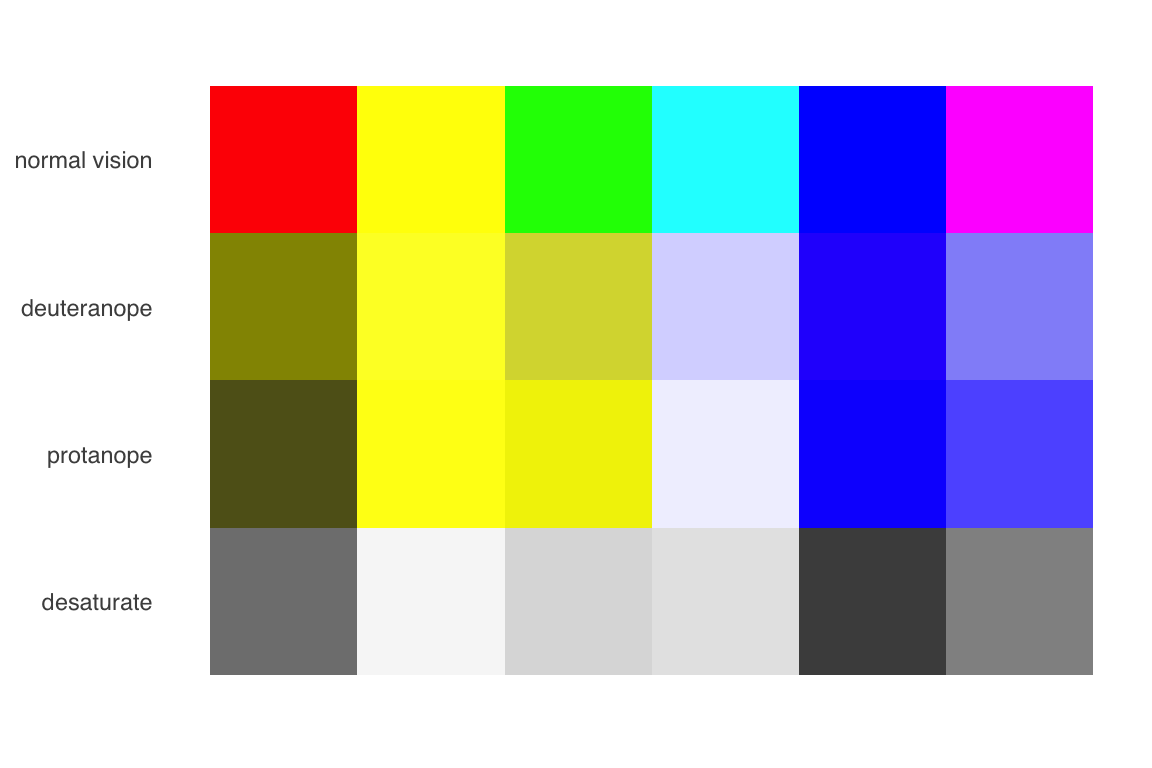
The viridis color scale is discriminable under the most common forms of colour blindness, and reproduces well in greyscale.

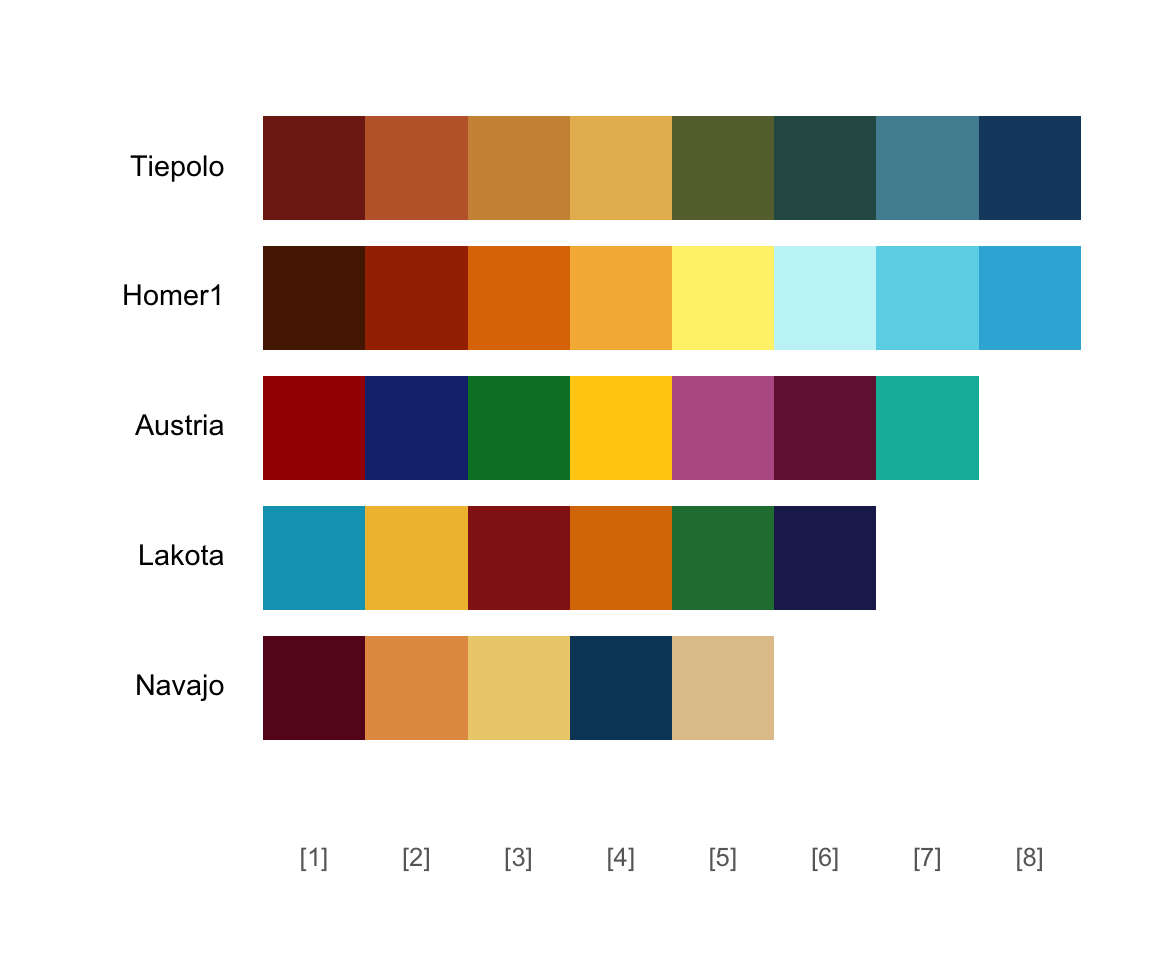
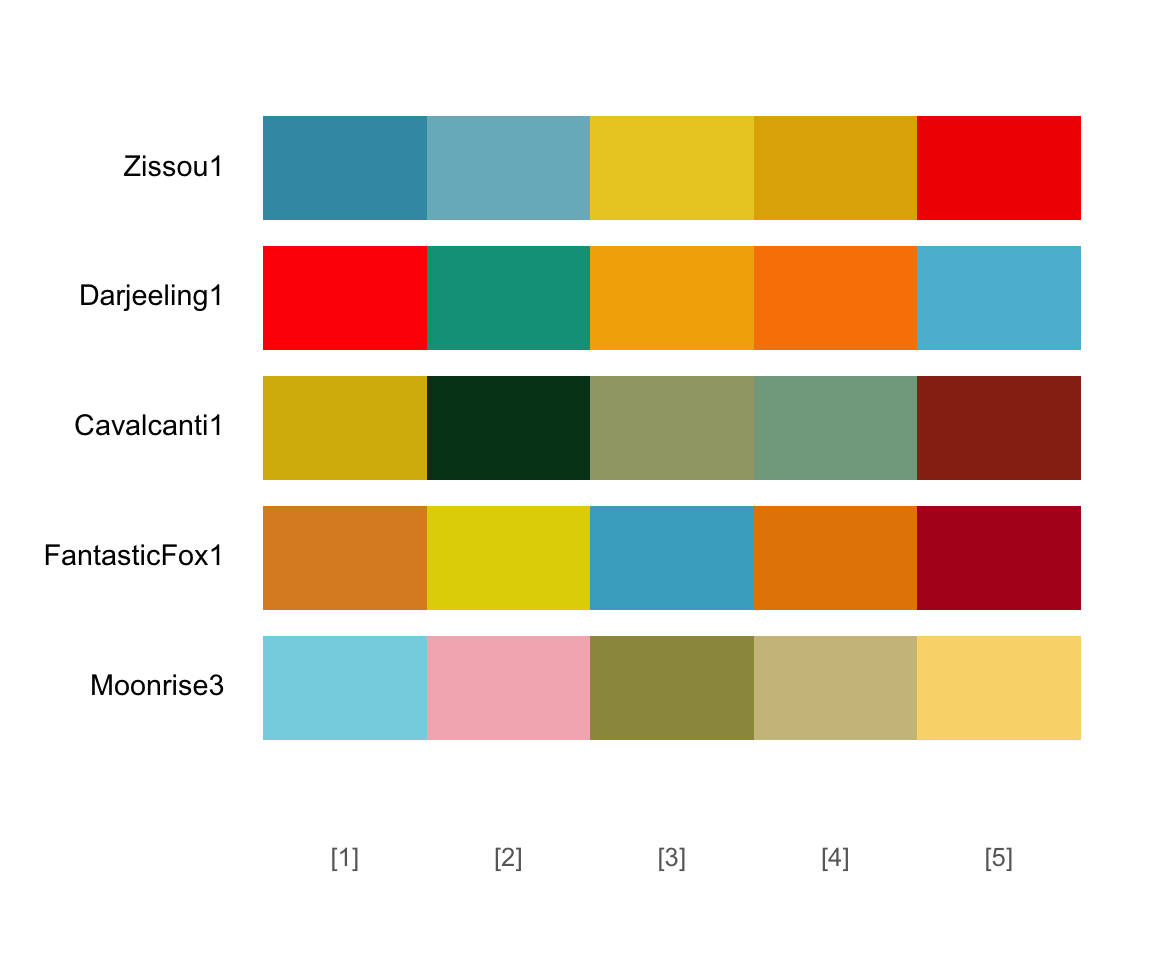
Fancy palettes
Bibliography
![]()
Scherer, Cédric (2022). Graphic design with ggplot2. https://rstudio-conf-2022.github.io/ggplot2-graphic-design/
Weber, Isabella M./Wasner, Evan (2023). Sellers’ inflation, profits and conflict: Why can large firms hike prices in an emergency? Review of Keynesian Economics, 11(2), 183–213. DOI: https://doi.org/10.4337/roke.2023.02.05
WuG Editorial board (2022). How to tackle the inflation crisis? Learnings from european case studies. Wirtschaft Und Gesellschaft, 48(4), 497–518.
Zuckerstätter, Sepp/Kafenda, Lukas/Muckenhuber, Mattias/Russinger, Reinhold (2022). Austria: Policies dealing with the inflation crisis. Wirtschaft Und Gesellschaft, 48(4), 578–598.