Economic Policy Visualization
Growth · Geometries
March 27, 2023
The growth imperative
- Growth is an important goal in economic policy
- Magic square of economic policy promotes high GDP growth (besides low inflation, high emplpoyment, and balanced trade)
- UN Sustainable Development Goals (SDG): “Promote inclusive and sustainable economic growth, employment and decent work for all”
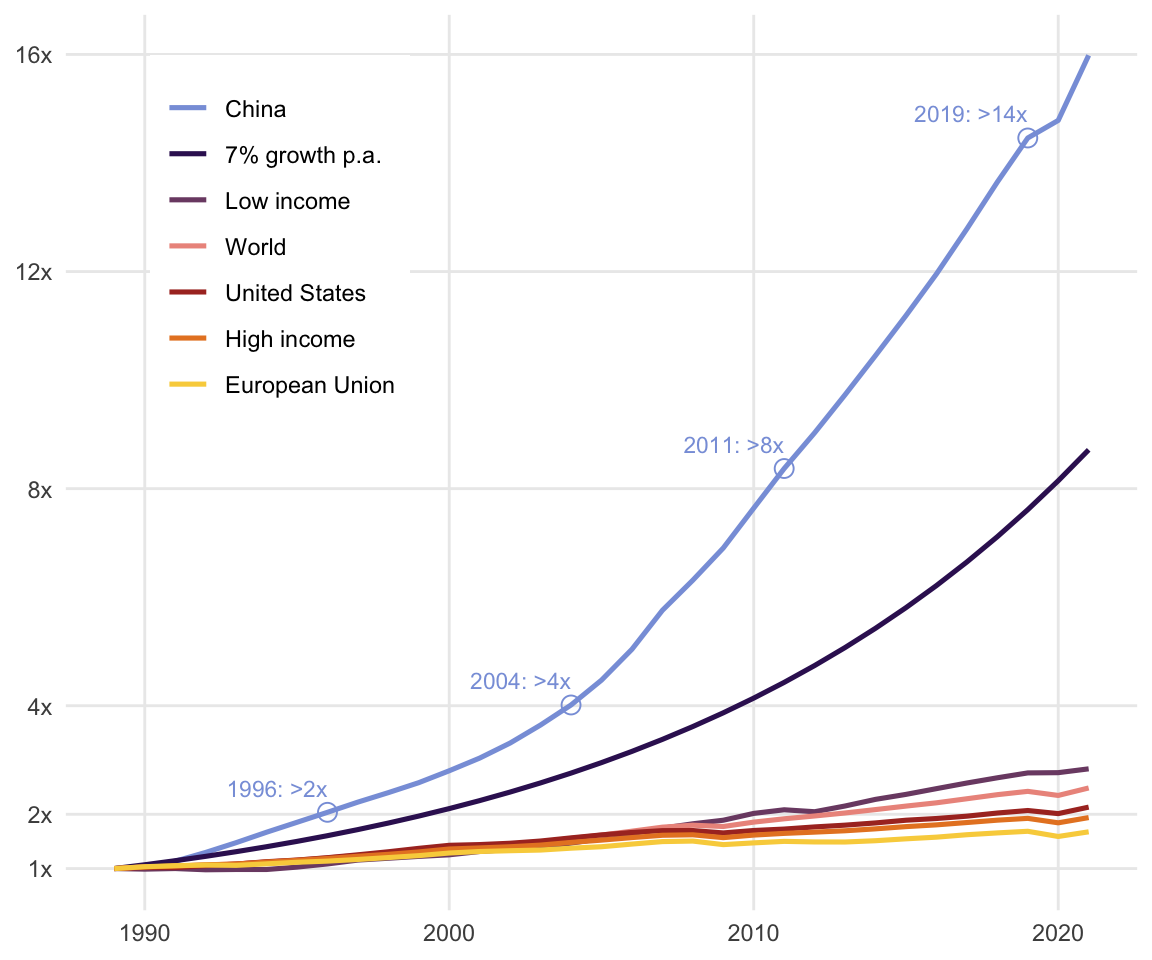
- More specifically, “sustain per capita economic growth in accordance with national circumstances and, in particular, at least 7 per cent gross domestic product growth per annum in the least developed countries”
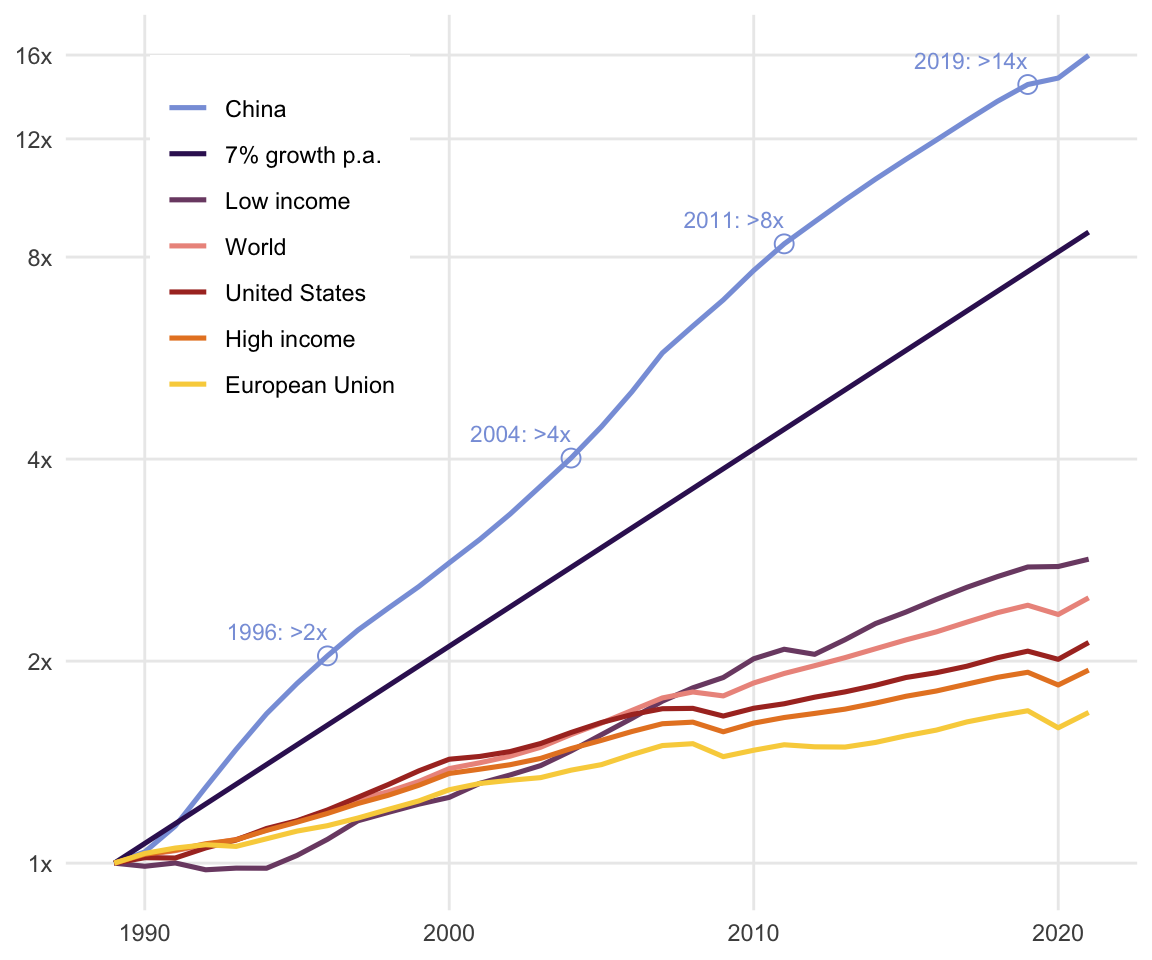
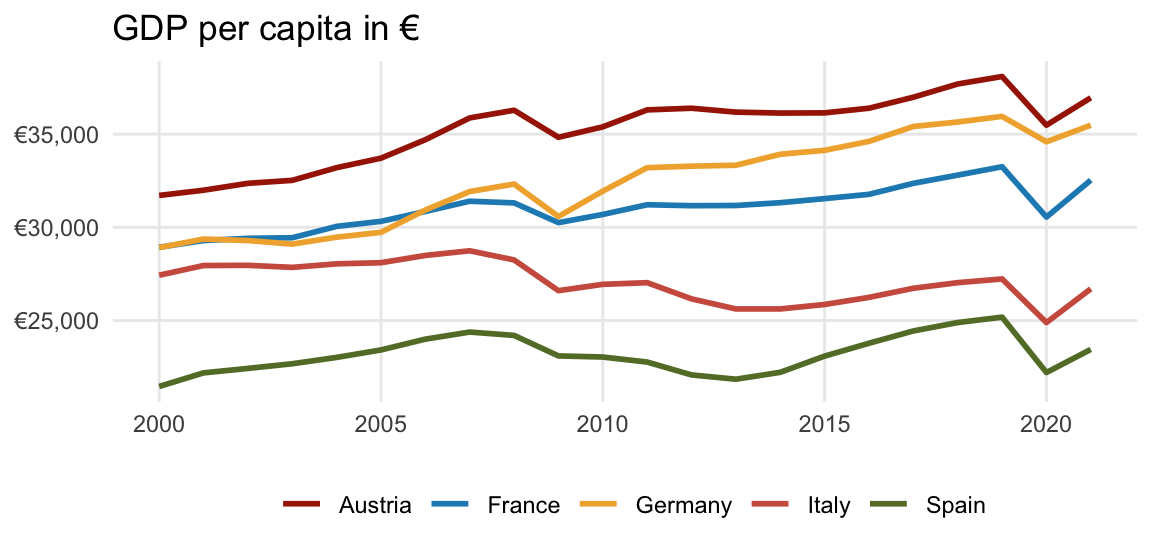
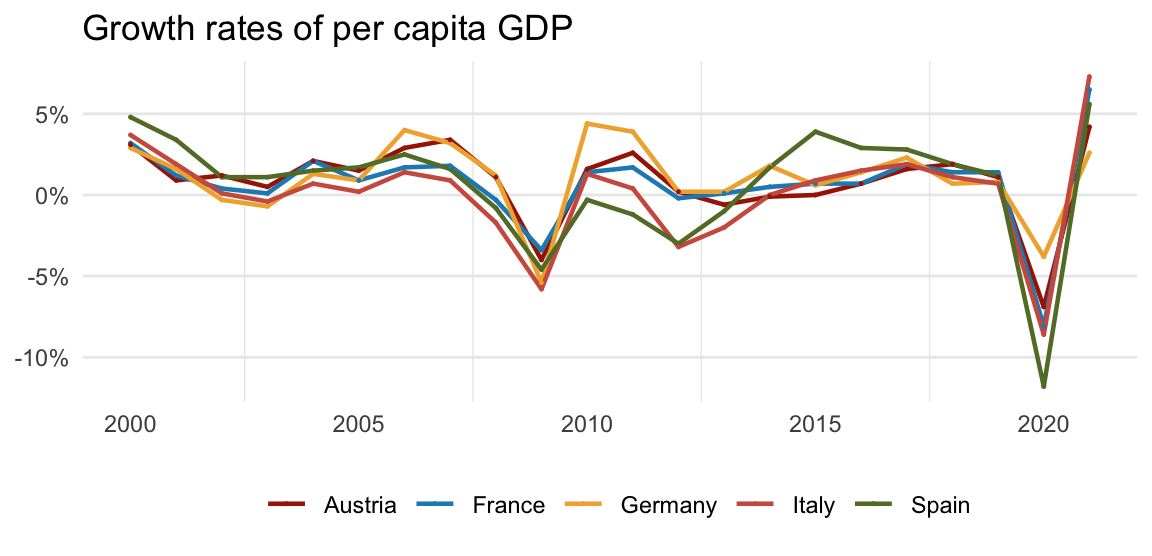
GDP growth across the globe
Linear scale (1989 = 1)
Logarithmic scale (1989 = 1)
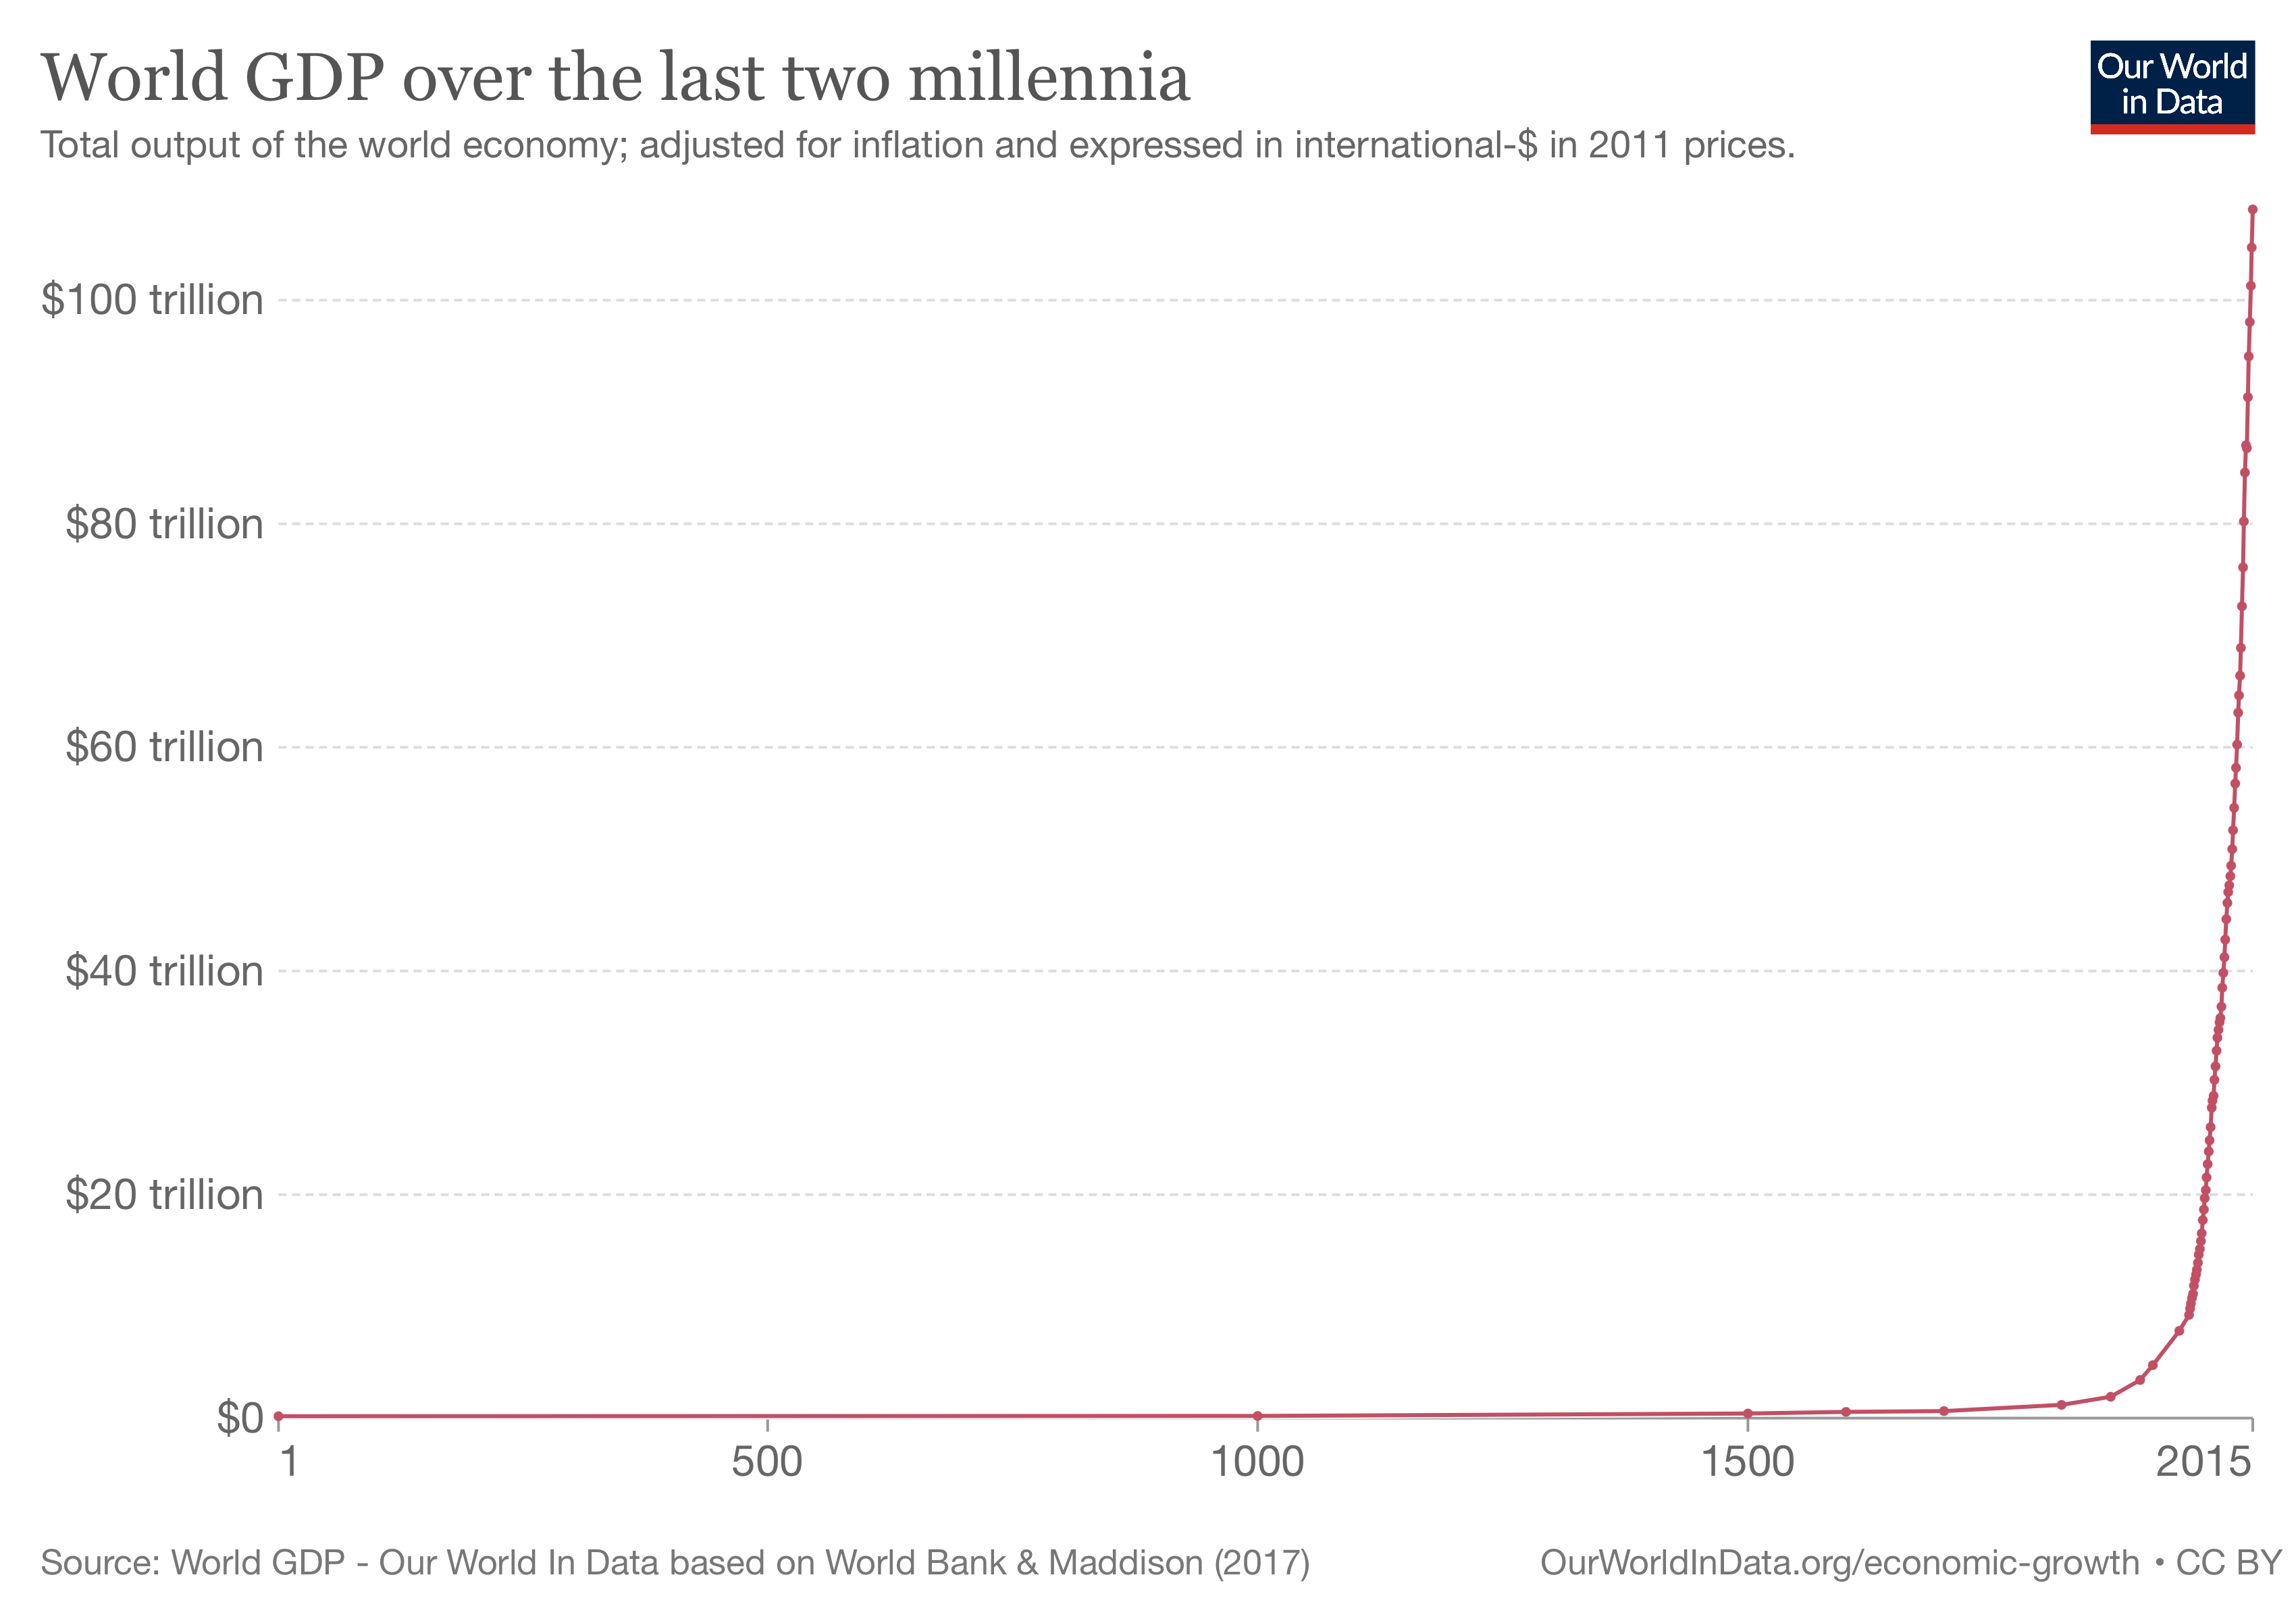
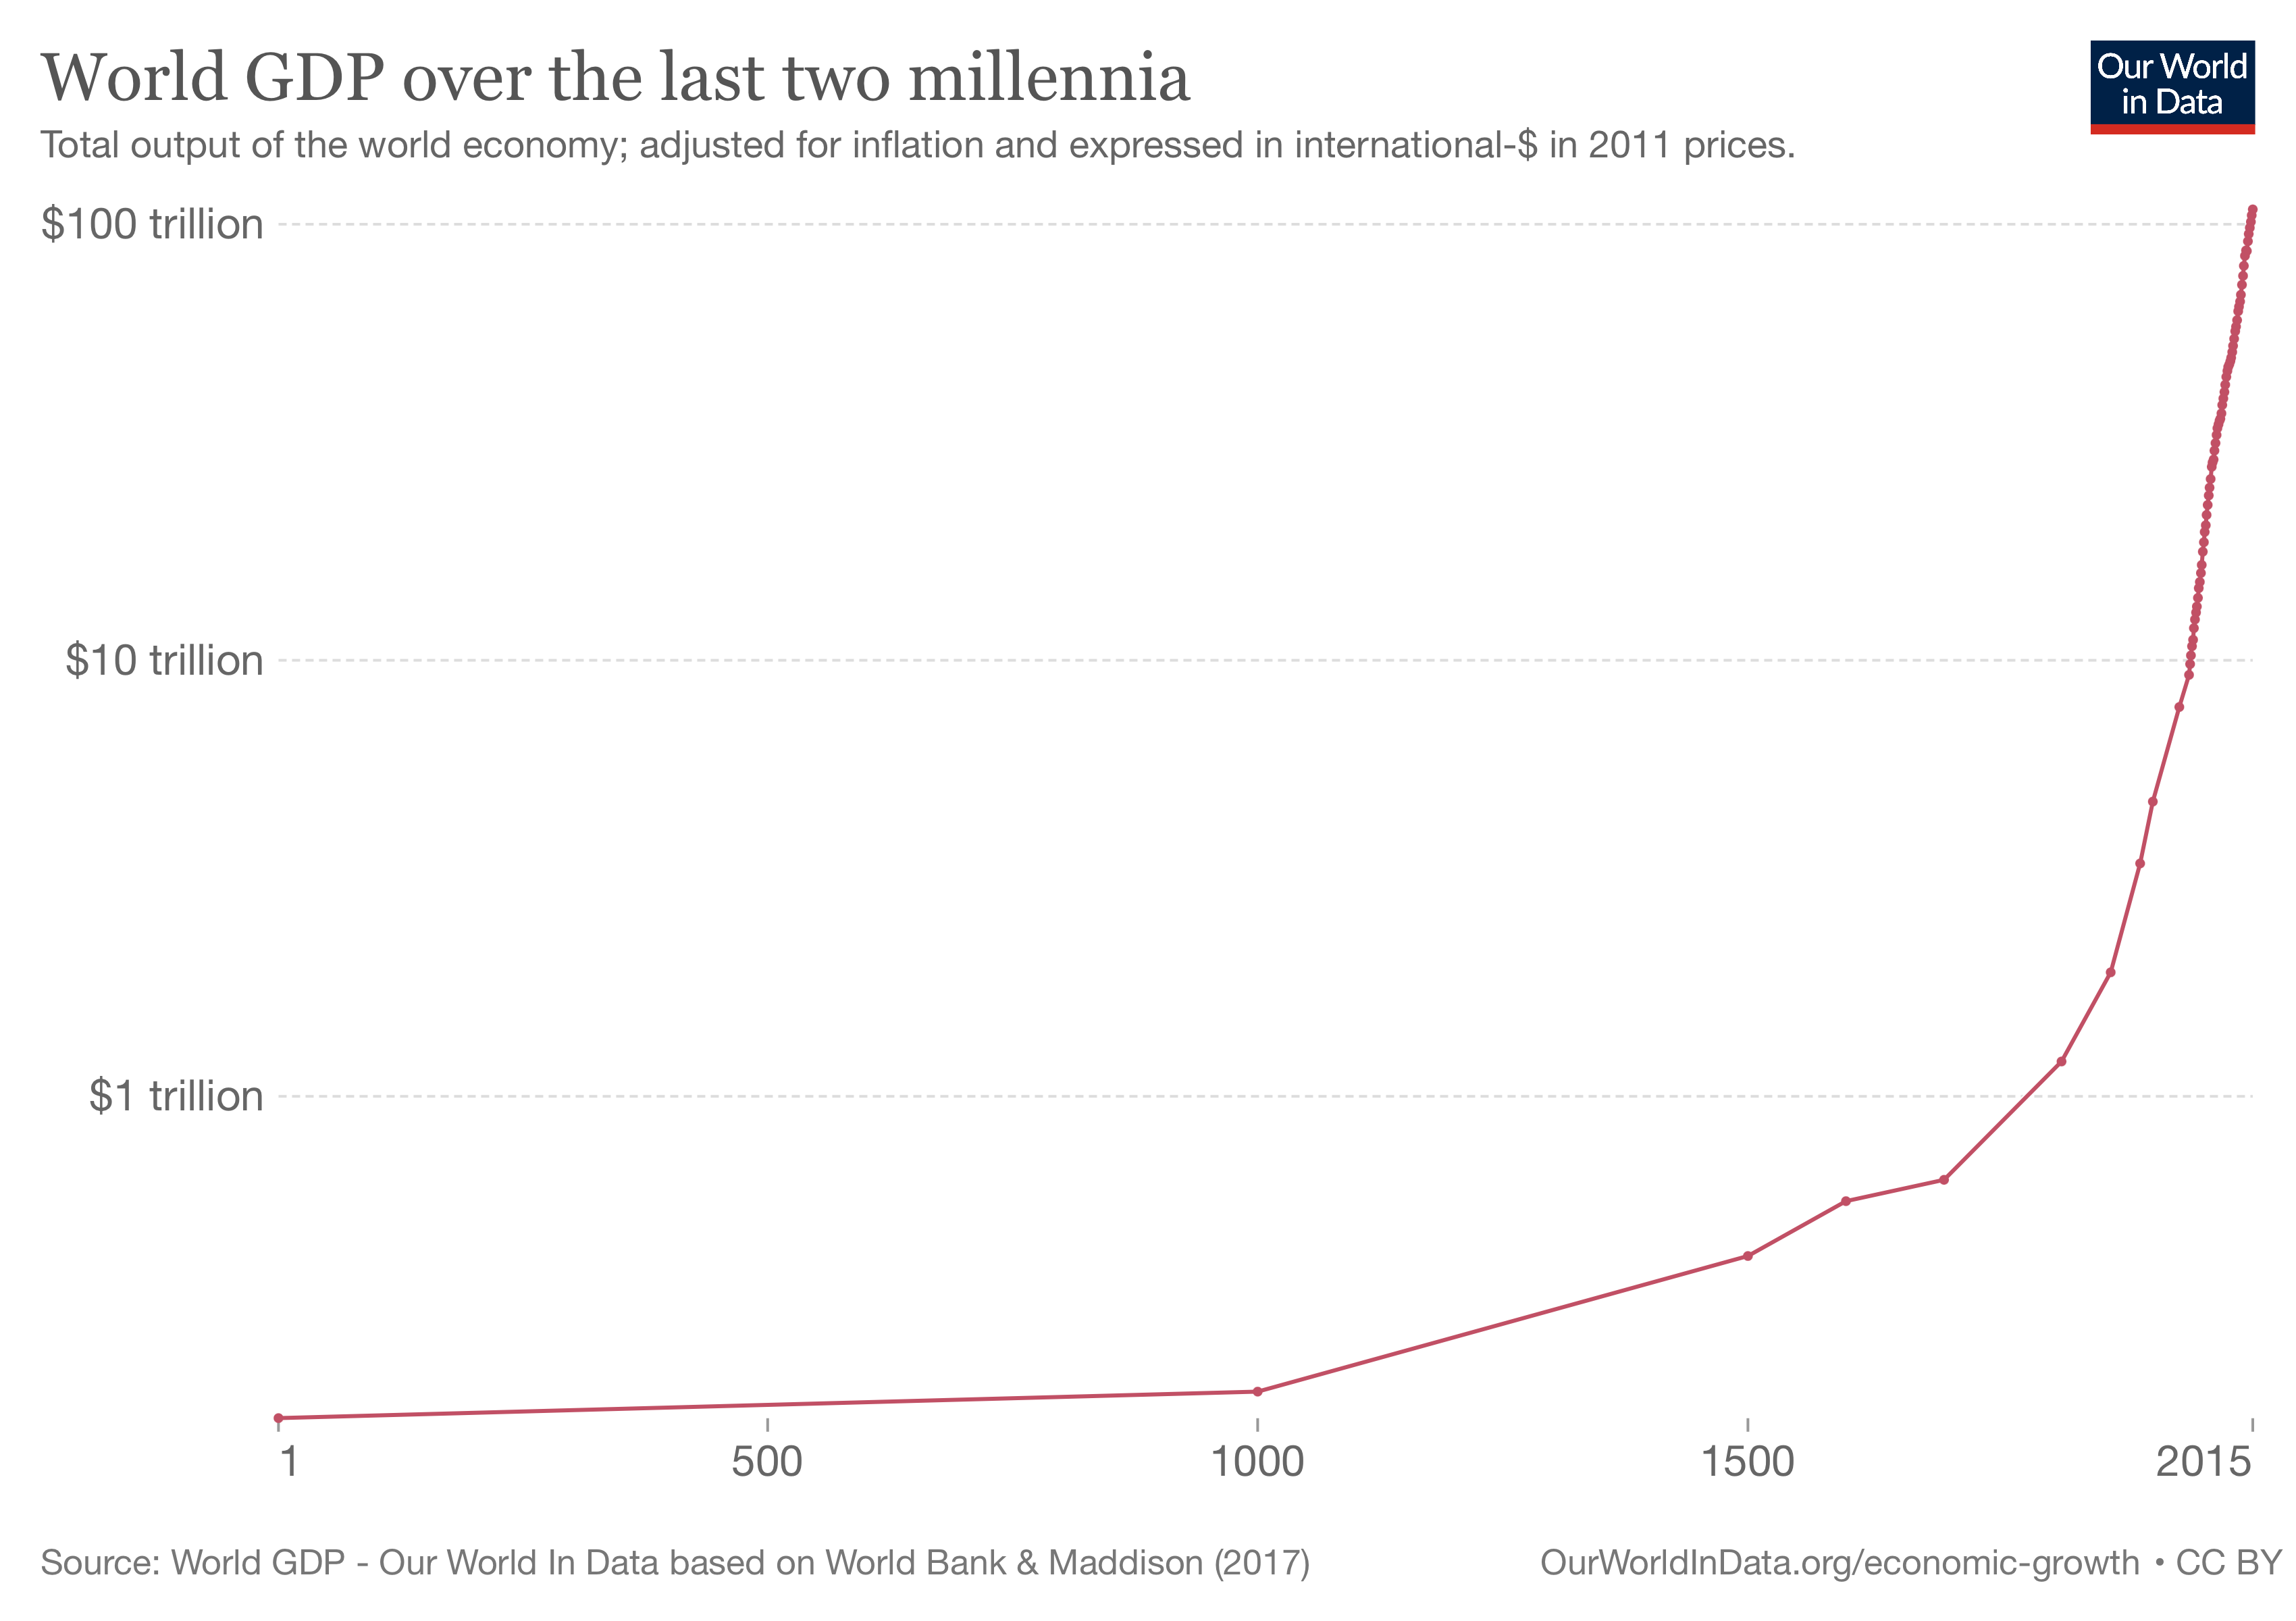
Reeeally long-term growth of GDP
Linear scale
Logarithmic scale
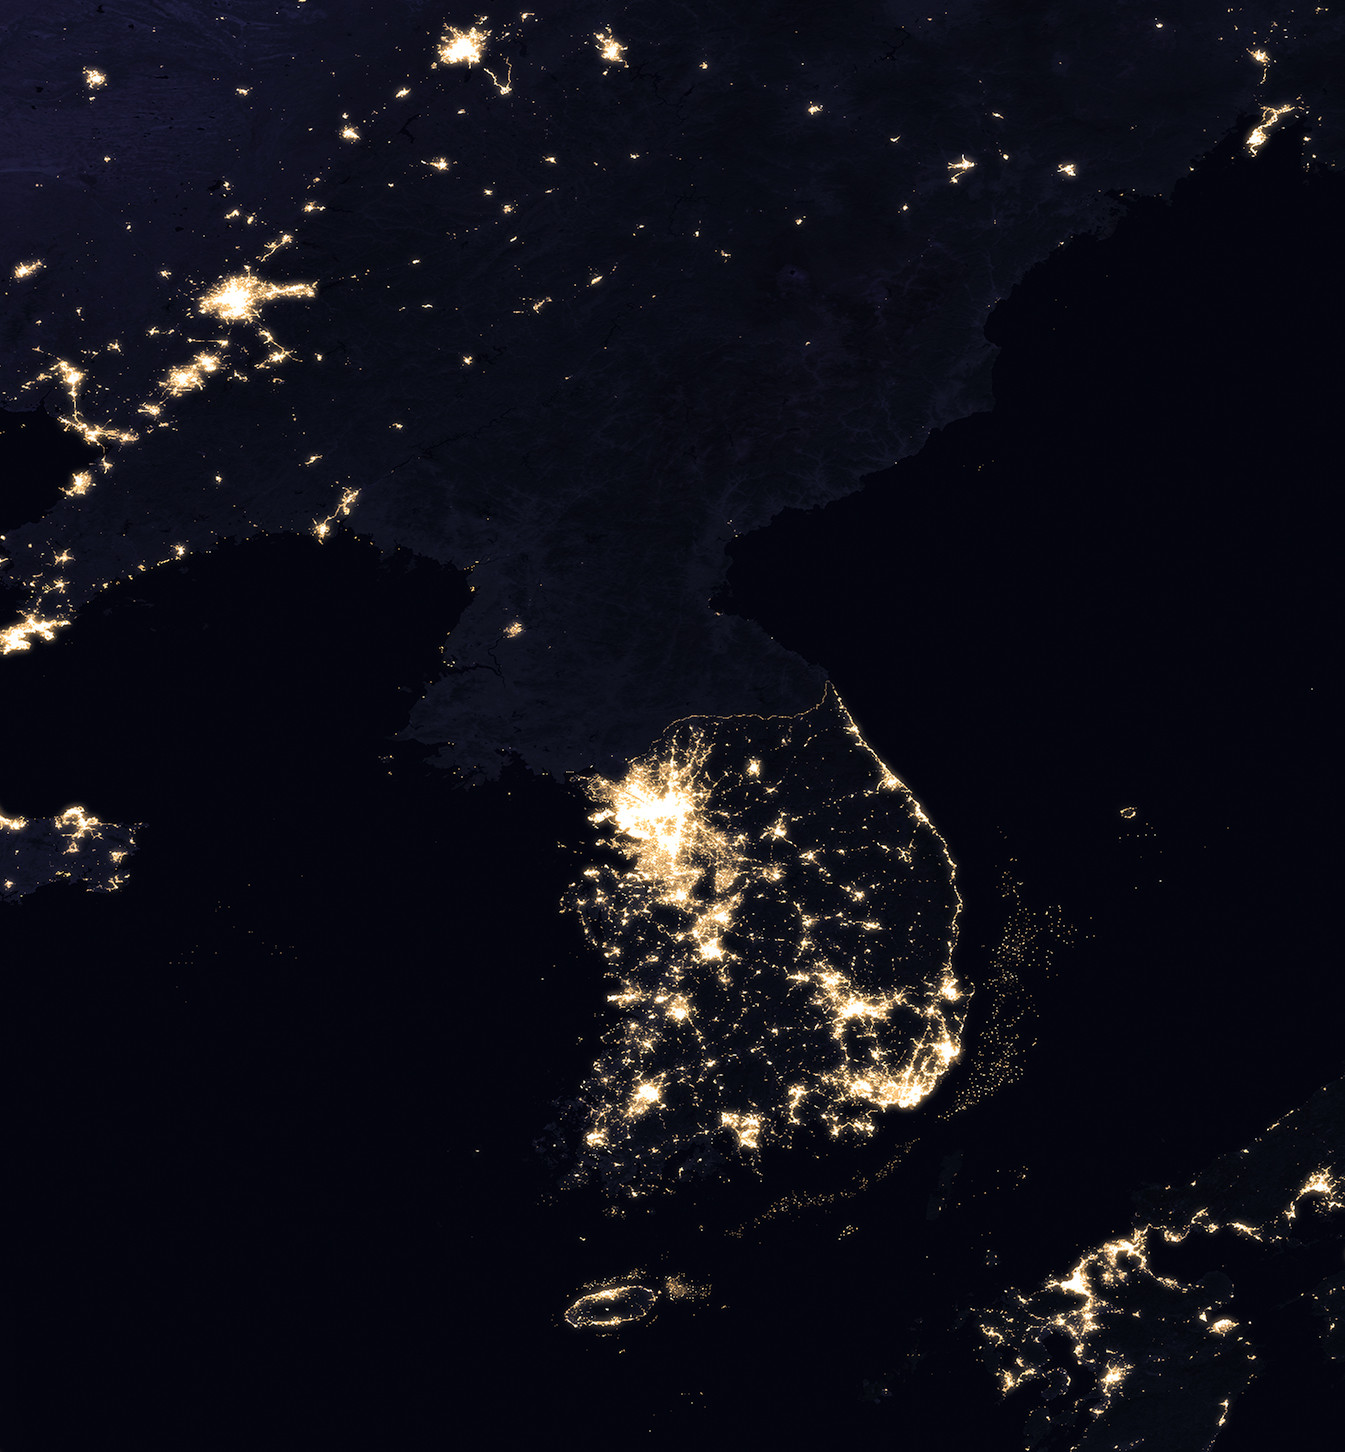
Why do some economies grow and others don’t?
Which chart describes best what you want to show?
Show me your geometries!
Selected geometries in {ggplot}
| Geometry | Explanation | |
|---|---|---|
| area, ribbon | An area plot is the continuous analogue of a stacked bar chart. | |
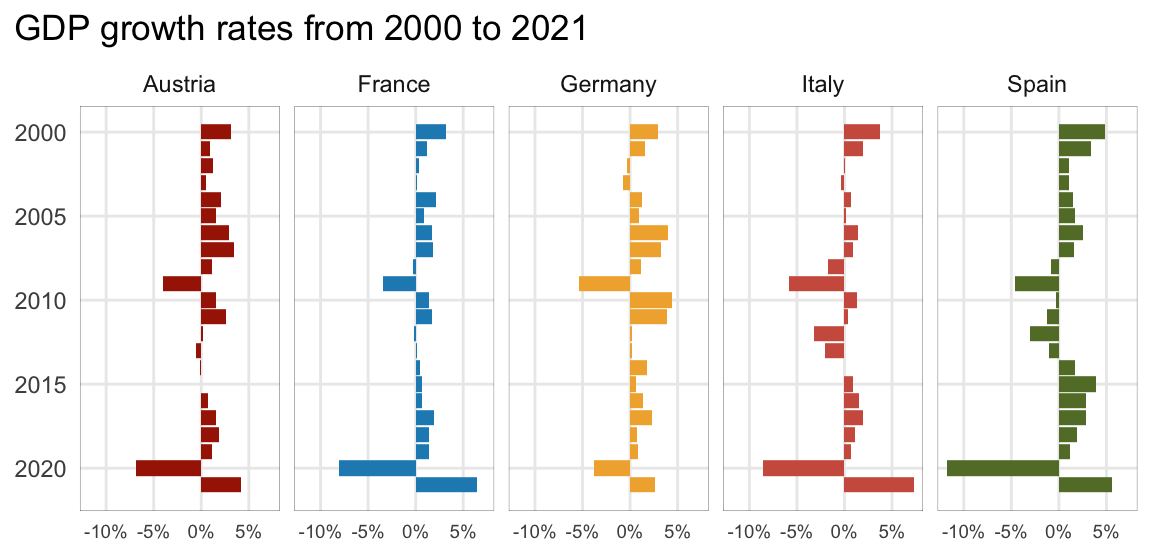
| bar, col | Bar charts may be proportional (bar) or with absolute values (col). | |
| boxplot | The boxplot compactly displays the distribution of a continuous variable. | |
| density, histogram | Kernel density plot, which is a smoothed version of the histogram. | |
| hline, vline, abline | Draws a horizontal or vertical line with an intercept or a line with a slope. | |
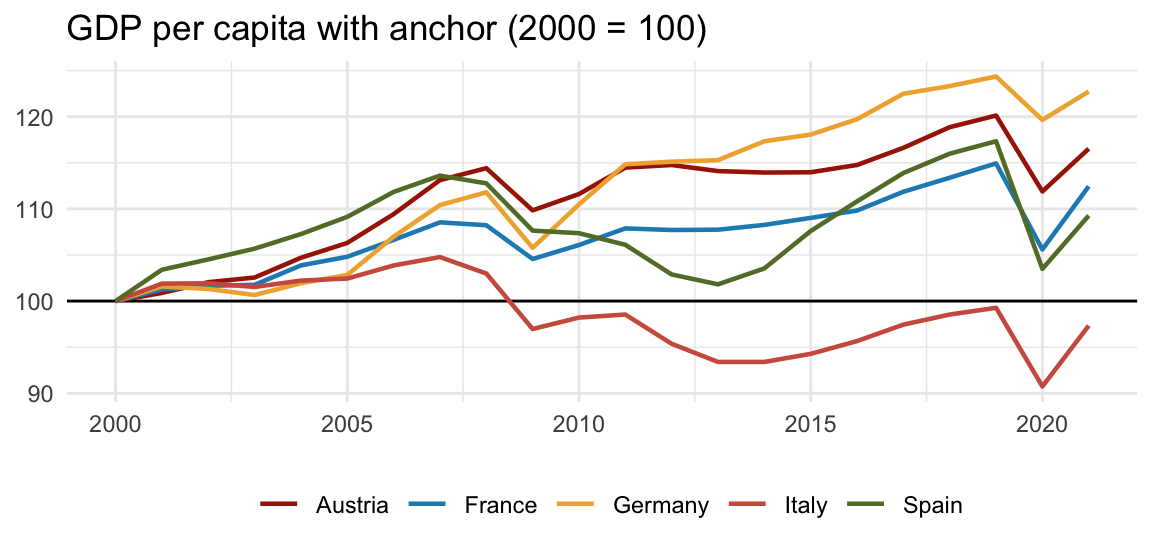
| line, path | Line between observations in order of variable (line) or appearance (path) | |
| linerange, errorbar | Various ways of representing a vertical interval defined by x, ymin and ymax. | |
| point, jitter | The point geom is used to create scatterplots and jitter avoids overplotting. | |
| segment, curve | Draws a straight or curved line between points (x,y) and (xend, yend). | |
| smooth | Smoothed line with standard error bounds across a scatterplot. | |
| violin | A violin plot is a compact display of a continuous distribution. |
Additional geometries
ggstream::geom_stream() 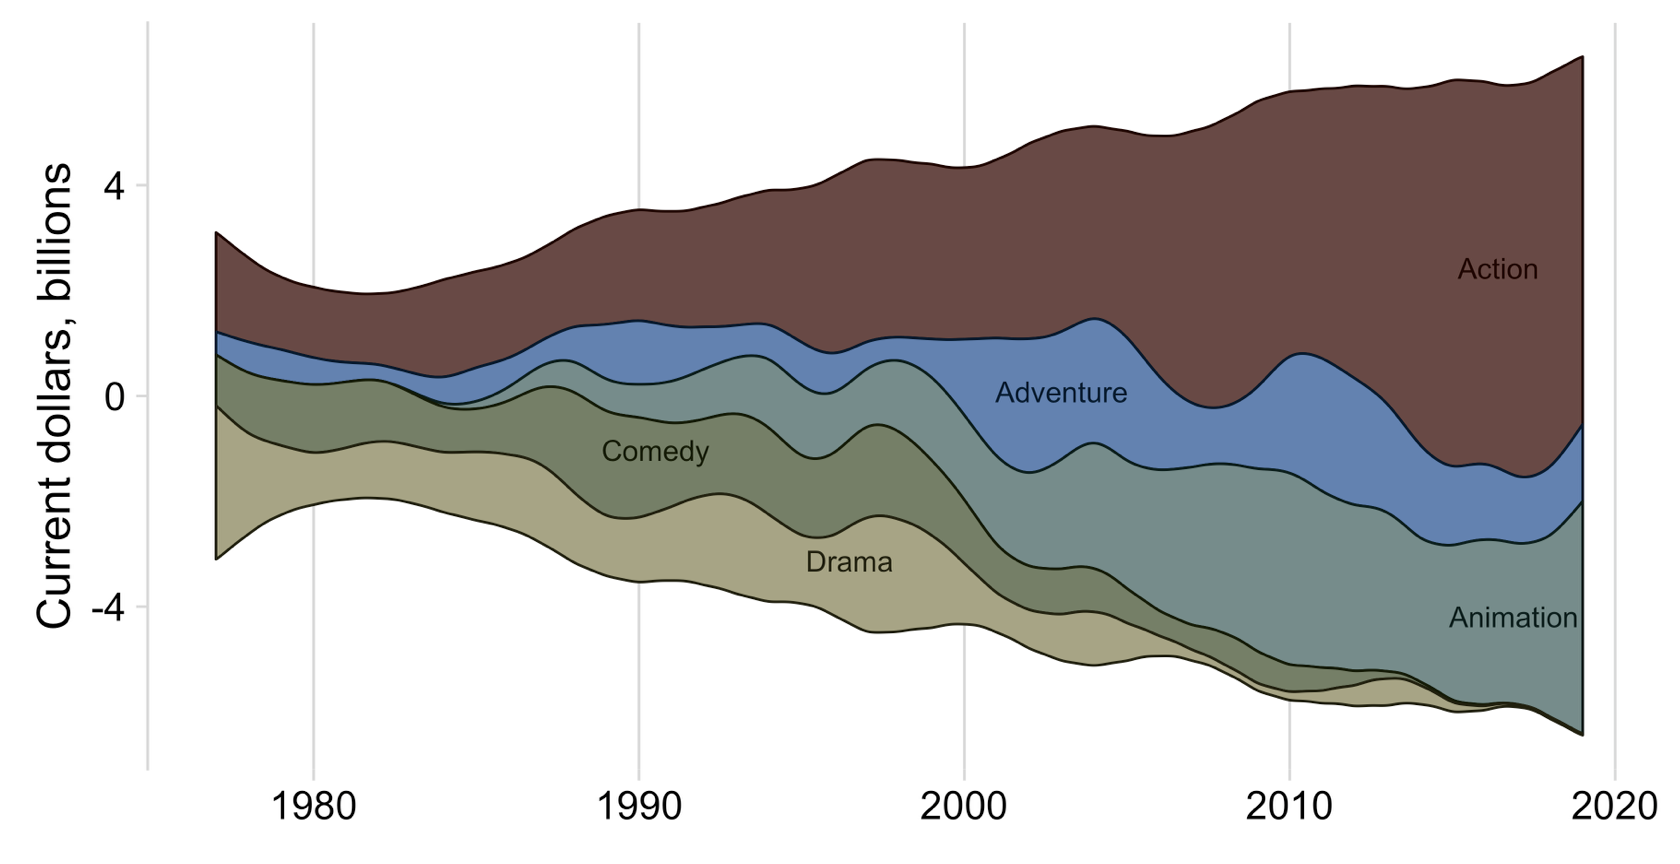
waffle::geom_waffle() 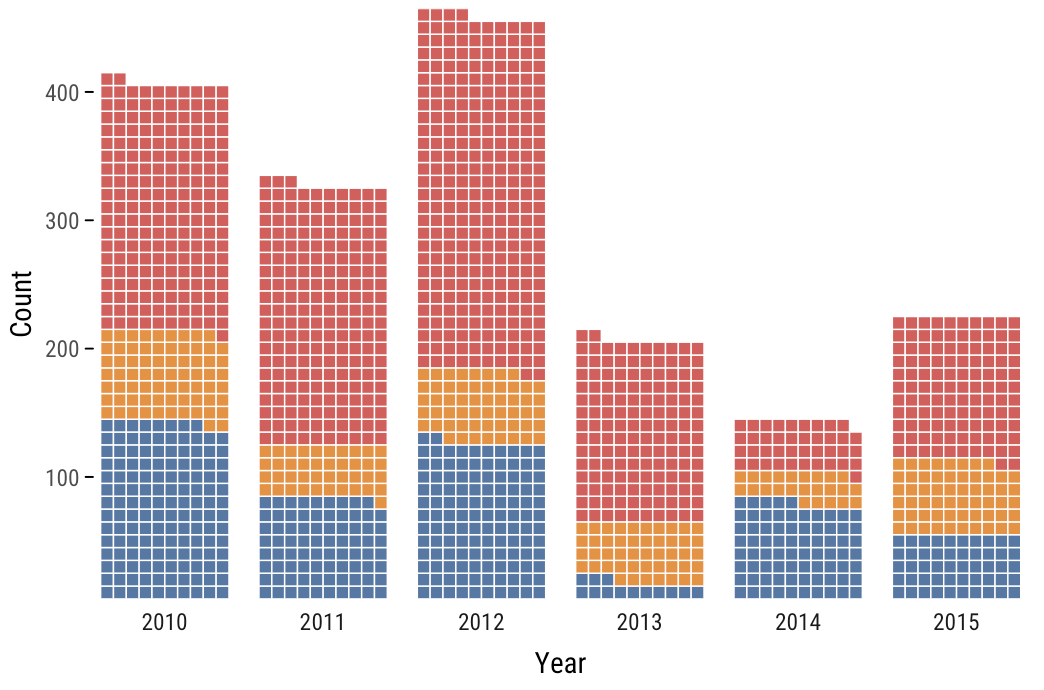
ggchicklet::geom_chicklet() 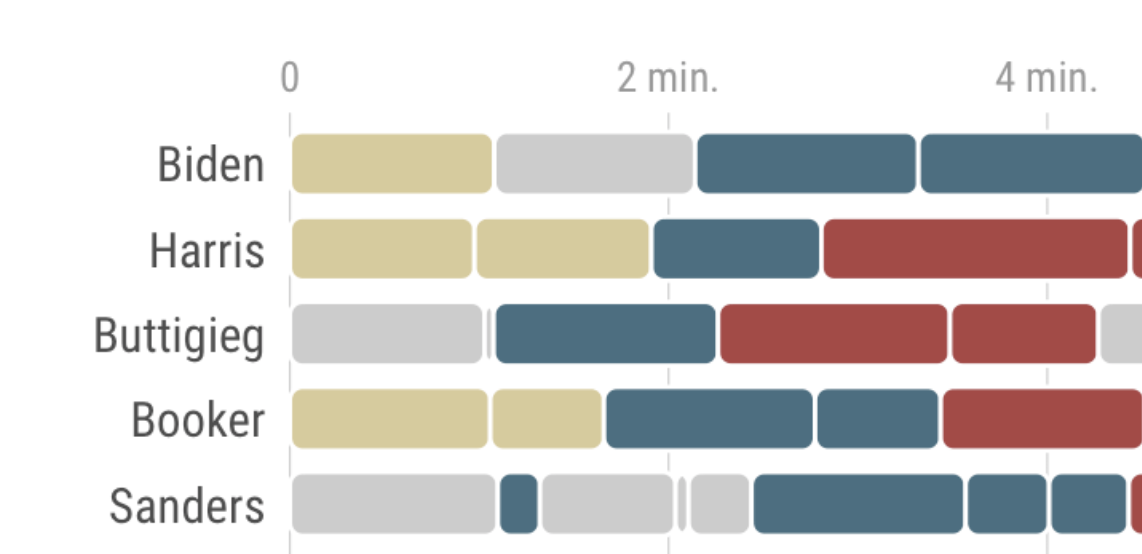
ggridges::geom_density_ridges() 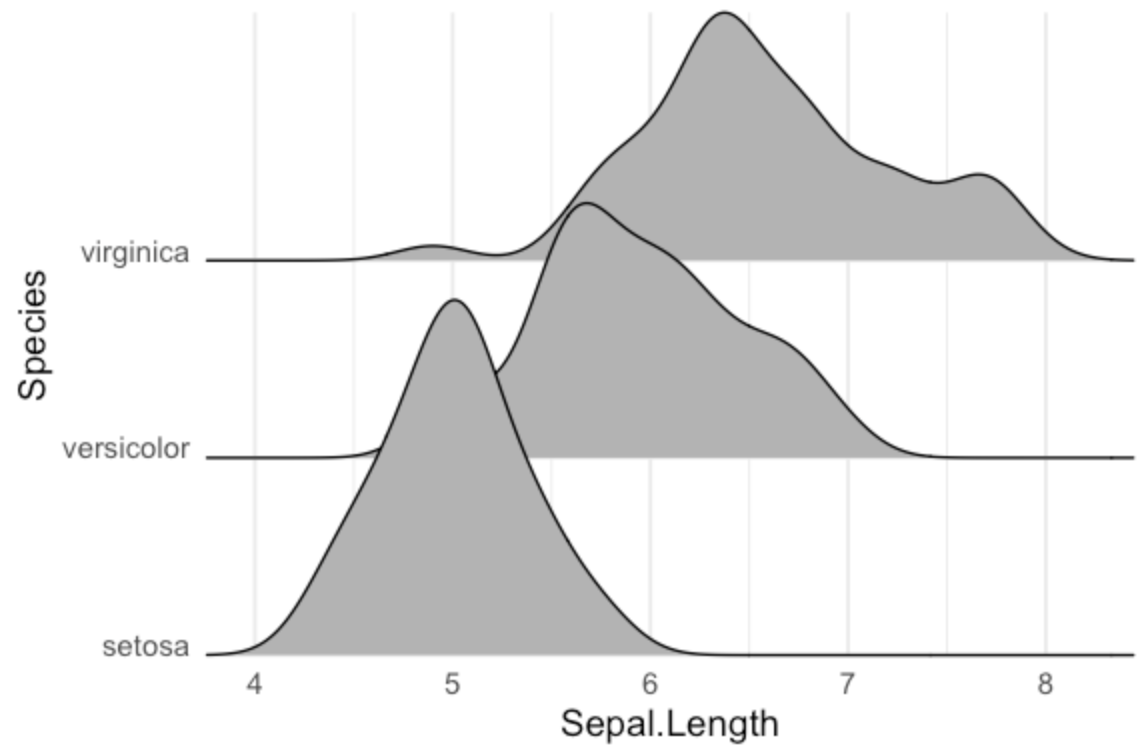
ggsankey::geom_sankey() 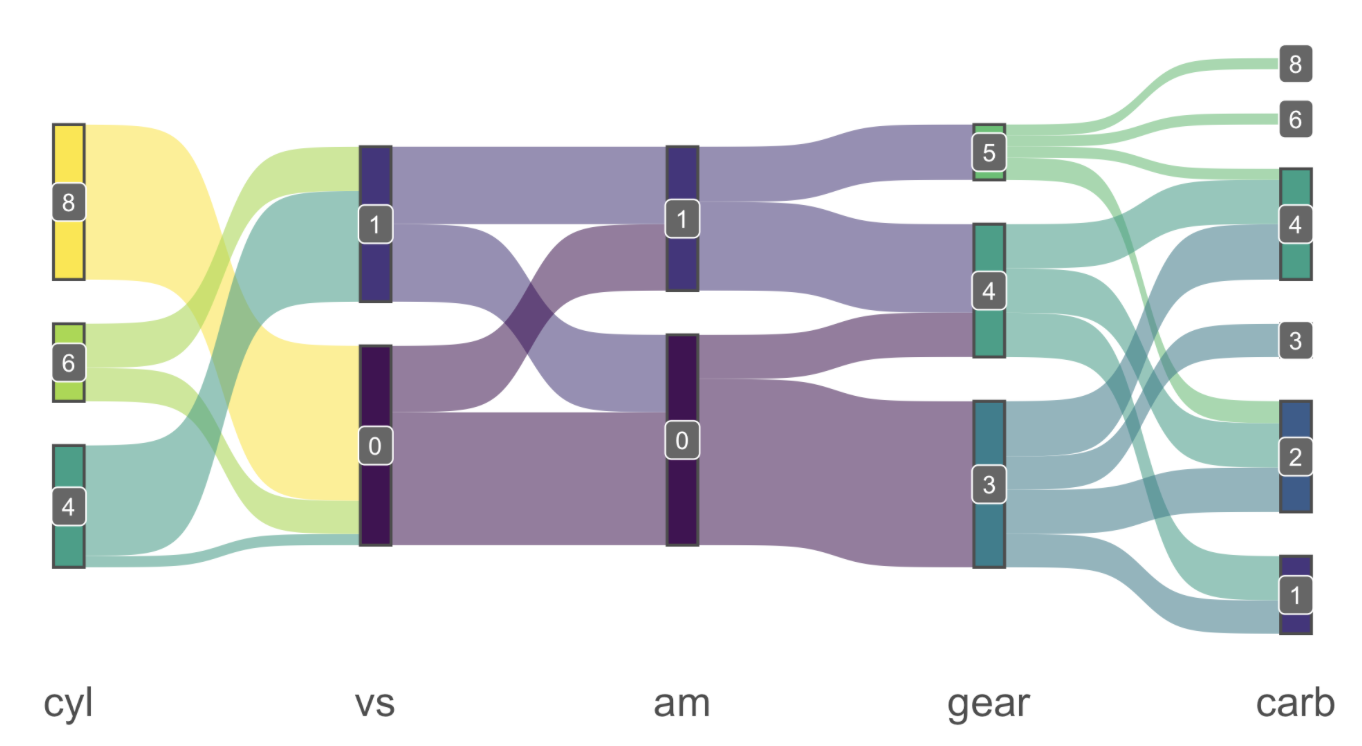
ggbump::geom_bump() 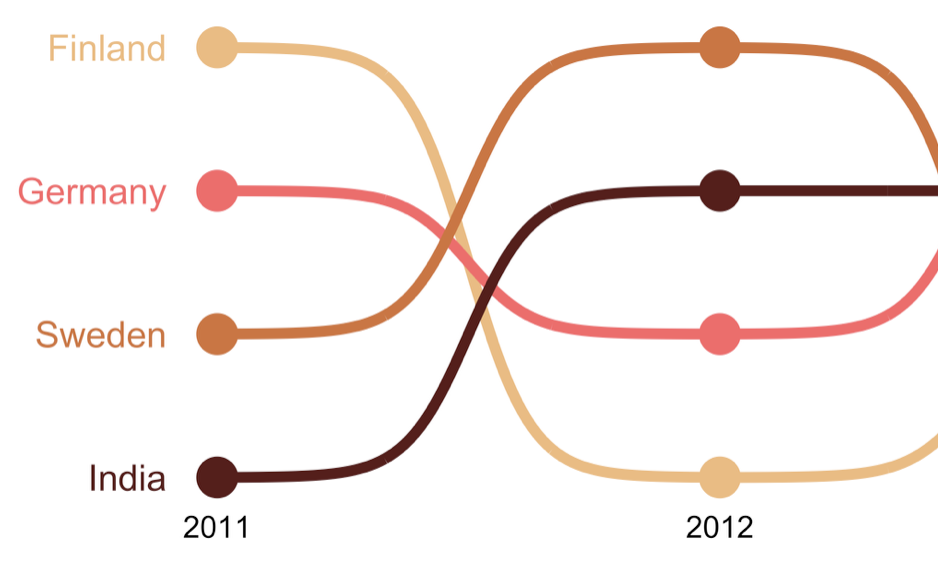
Bibliography
![]()
Acemoglu, Daron/Naidu, Suresh/Restrepo, Pascual/Robinson, James A. (2019). Democracy does cause growth. Journal of Political Economy, 127(1), 47–100. DOI: 10.1086/700936
Cuaresma, Jesús Crespo/Danylo, Olha/Fritz, Steffen/Hofer, Martin/Kharas, Homi/Bayas, Juan Carlos Laso (2020). What do we know about poverty in north korea? Palgrave Communications, 6(40). DOI: 10.1057/s41599-020-0417-4
Glaeser, Edward L./Porta, Rafael La/Lopez-de-Silanes, Florencio/Shleifer, Andrei (2004). Do institutions cause growth? Journal of Economic Growth, 9(3), 271–303. DOI: 10.1023/b:joeg.0000038933.16398.ed
Mankiw, N. G./Romer, D./Weil, D. N. (1992). A contribution to the empirics of economic growth. The Quarterly Journal of Economics, 107(2), 407–437. DOI: 10.2307/2118477
Tobin, James (1964). Economic growth as an objective of government policy. American Economic Review, 54(3), 1–20.
Young, A. (1995). The tyranny of numbers: Confronting the statistical realities of the east asian growth experience. The Quarterly Journal of Economics, 110(3), 641–680. DOI: 10.2307/2946695