| Obs. | X | Y | X | Y | X | Y | X | Y |
|---|---|---|---|---|---|---|---|---|
| 1 | 10.00 | 8.04 | 10.00 | 9.14 | 10.00 | 7.46 | 8.00 | 6.58 |
| 2 | 8.00 | 6.95 | 8.00 | 8.14 | 8.00 | 6.77 | 8.00 | 5.76 |
| 3 | 13.00 | 7.58 | 13.00 | 8.74 | 13.00 | 12.74 | 8.00 | 7.71 |
| 4 | 9.00 | 8.81 | 9.00 | 8.77 | 9.00 | 7.11 | 8.00 | 8.84 |
| 5 | 11.00 | 8.33 | 11.00 | 9.26 | 11.00 | 7.81 | 8.00 | 8.47 |
| 6 | 14.00 | 9.96 | 14.00 | 8.10 | 14.00 | 8.84 | 8.00 | 7.04 |
| 7 | 6.00 | 7.24 | 6.00 | 6.13 | 6.00 | 6.08 | 8.00 | 5.25 |
| 8 | 4.00 | 4.26 | 4.00 | 3.10 | 4.00 | 5.39 | 19.00 | 12.50 |
| 9 | 12.00 | 10.84 | 12.00 | 9.13 | 12.00 | 8.15 | 8.00 | 5.56 |
| 10 | 7.00 | 4.82 | 7.00 | 7.26 | 7.00 | 6.42 | 8.00 | 7.91 |
| 11 | 5.00 | 5.68 | 5.00 | 4.74 | 5.00 | 5.73 | 8.00 | 6.89 |
| Mean | 9.00 | 7.50 | 9.00 | 7.50 | 9.00 | 7.50 | 9.00 | 7.50 |
| SD | 3.32 | 2.03 | 3.32 | 2.03 | 3.32 | 2.03 | 3.32 | 2.03 |
| Corr | 0.82 | 0.82 | 0.82 | 0.82 |
Economic Policy Visualization
Data
March 13, 2023
The era of evidence in economics
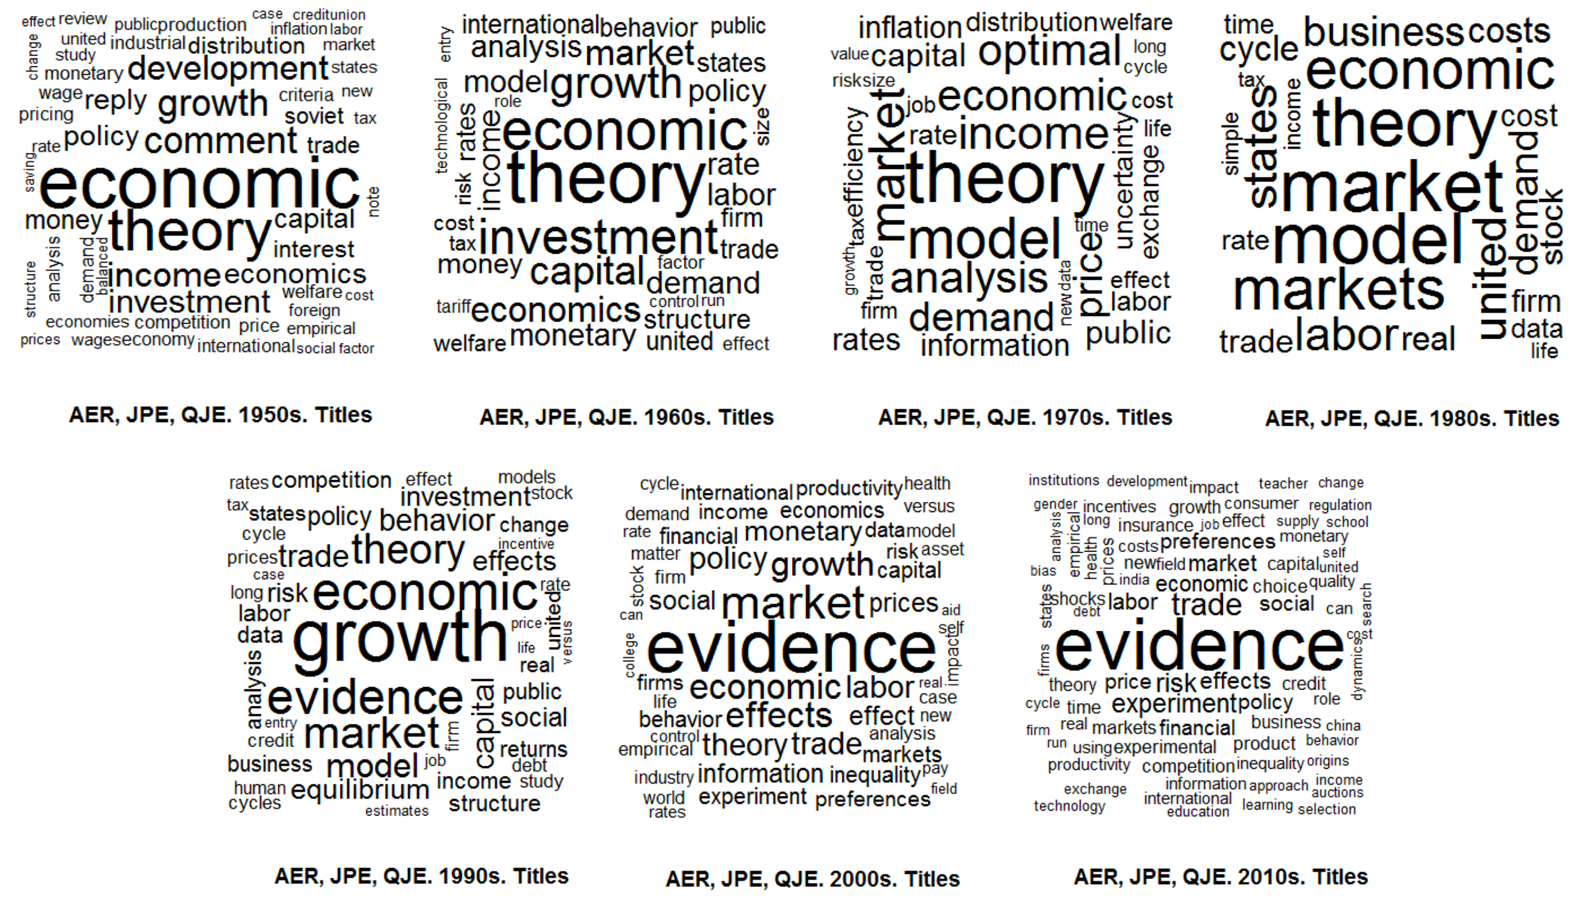
The figure shows the evolution of economics literature by text mining the 500 most-cited titles in top journals by decade. There is a shift from advancing theory towards empirical evidence.
The rise of empirical articles
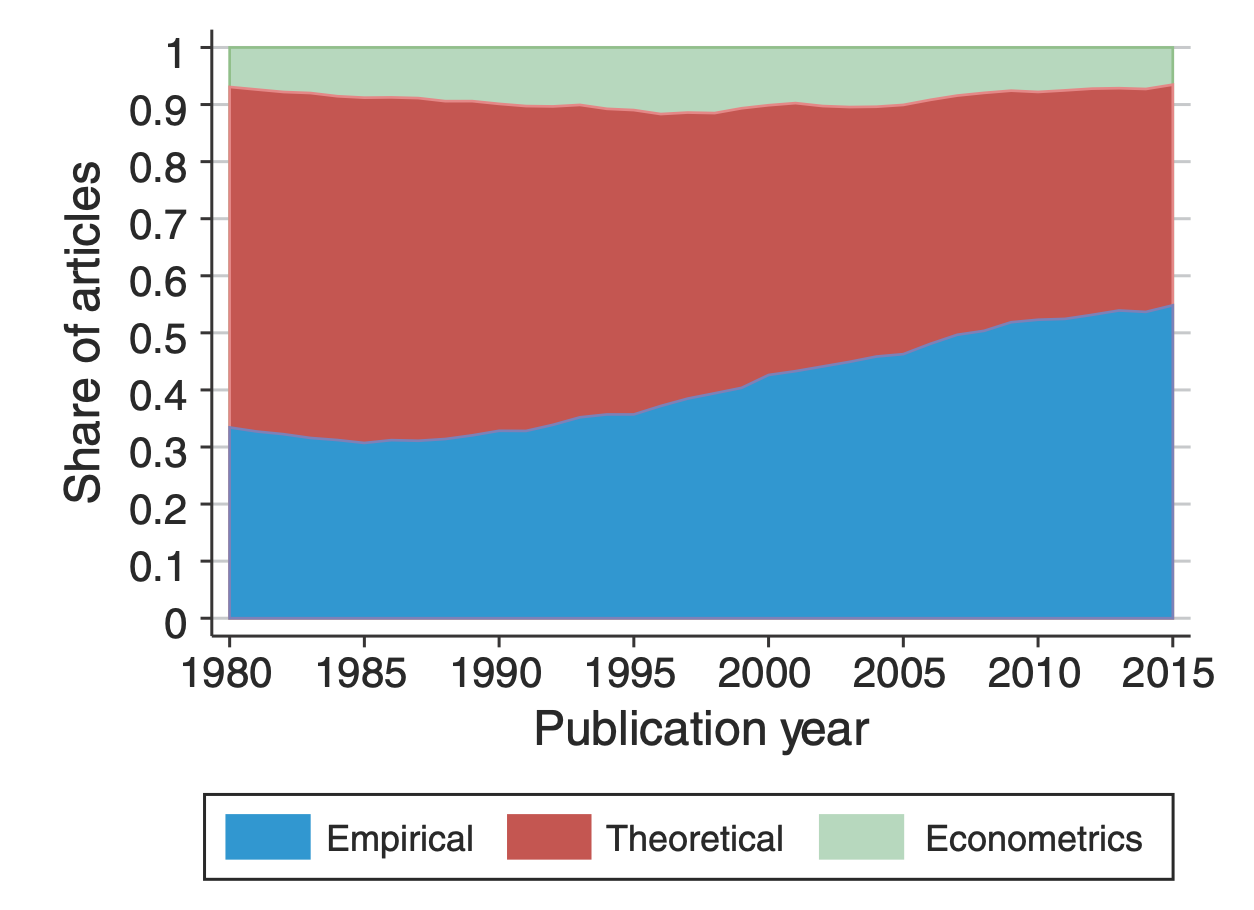 |
There is a distinct rise of empirical papers in economics. In the 1980s, around one third of publications was empirical. Today, it’s more than half. This trend is present in all sub-fields of the discipline (labor, finance, macro, etc.). The analyis is based on 134,892 papers published in 80 journals between 1980 and 2015. Papers are labeled as empirical if they use data to estimate economically meaningful parameters. |
Mind the (data) gap!
The limits of data
- Data is never a perfect reflection of the world!
- It’s only a subset: not crime but reported crime
- Information is collected by humans and processed by machines: imprecisions and errors are inevitable!
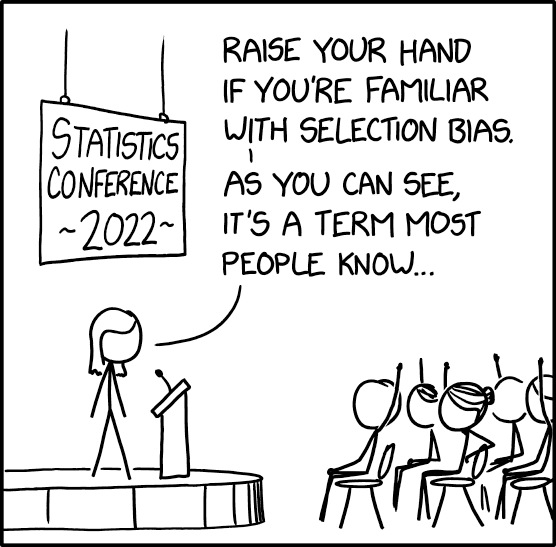
- Be aware of potential (cognitive and statistical) biases!
Invisible women
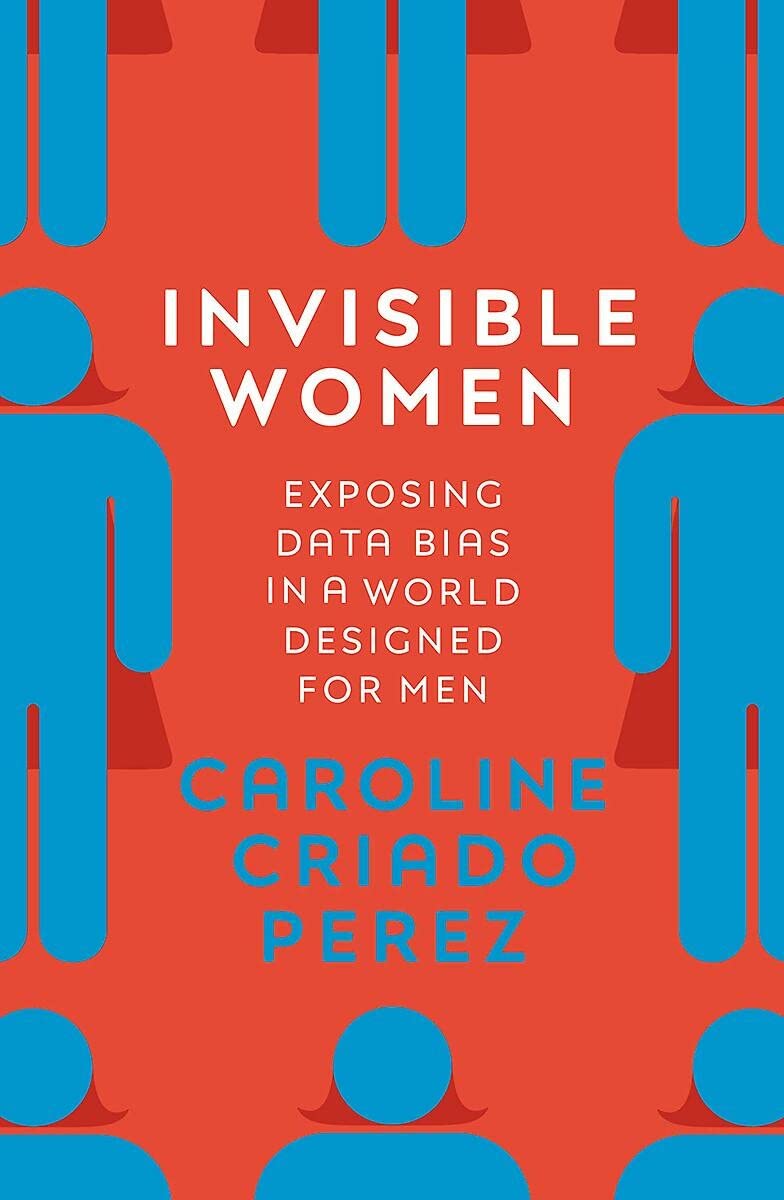 |
Caroline Criado Perez Exposing Data Bias in a World Designed for Men Random House Uk ISBN: 978-1-78470-628-9 The world we live in is built around male data, preferences, and assumptions. There are numerous examples of how the gender data gap has led to women being overlooked and undervalued in areas ranging from medicine to urban planning. To create a more just and equal society, we need to take into account the different experiences and needs of women and other marginalized groups in our data collection and decision-making processes. |
Invisible rich
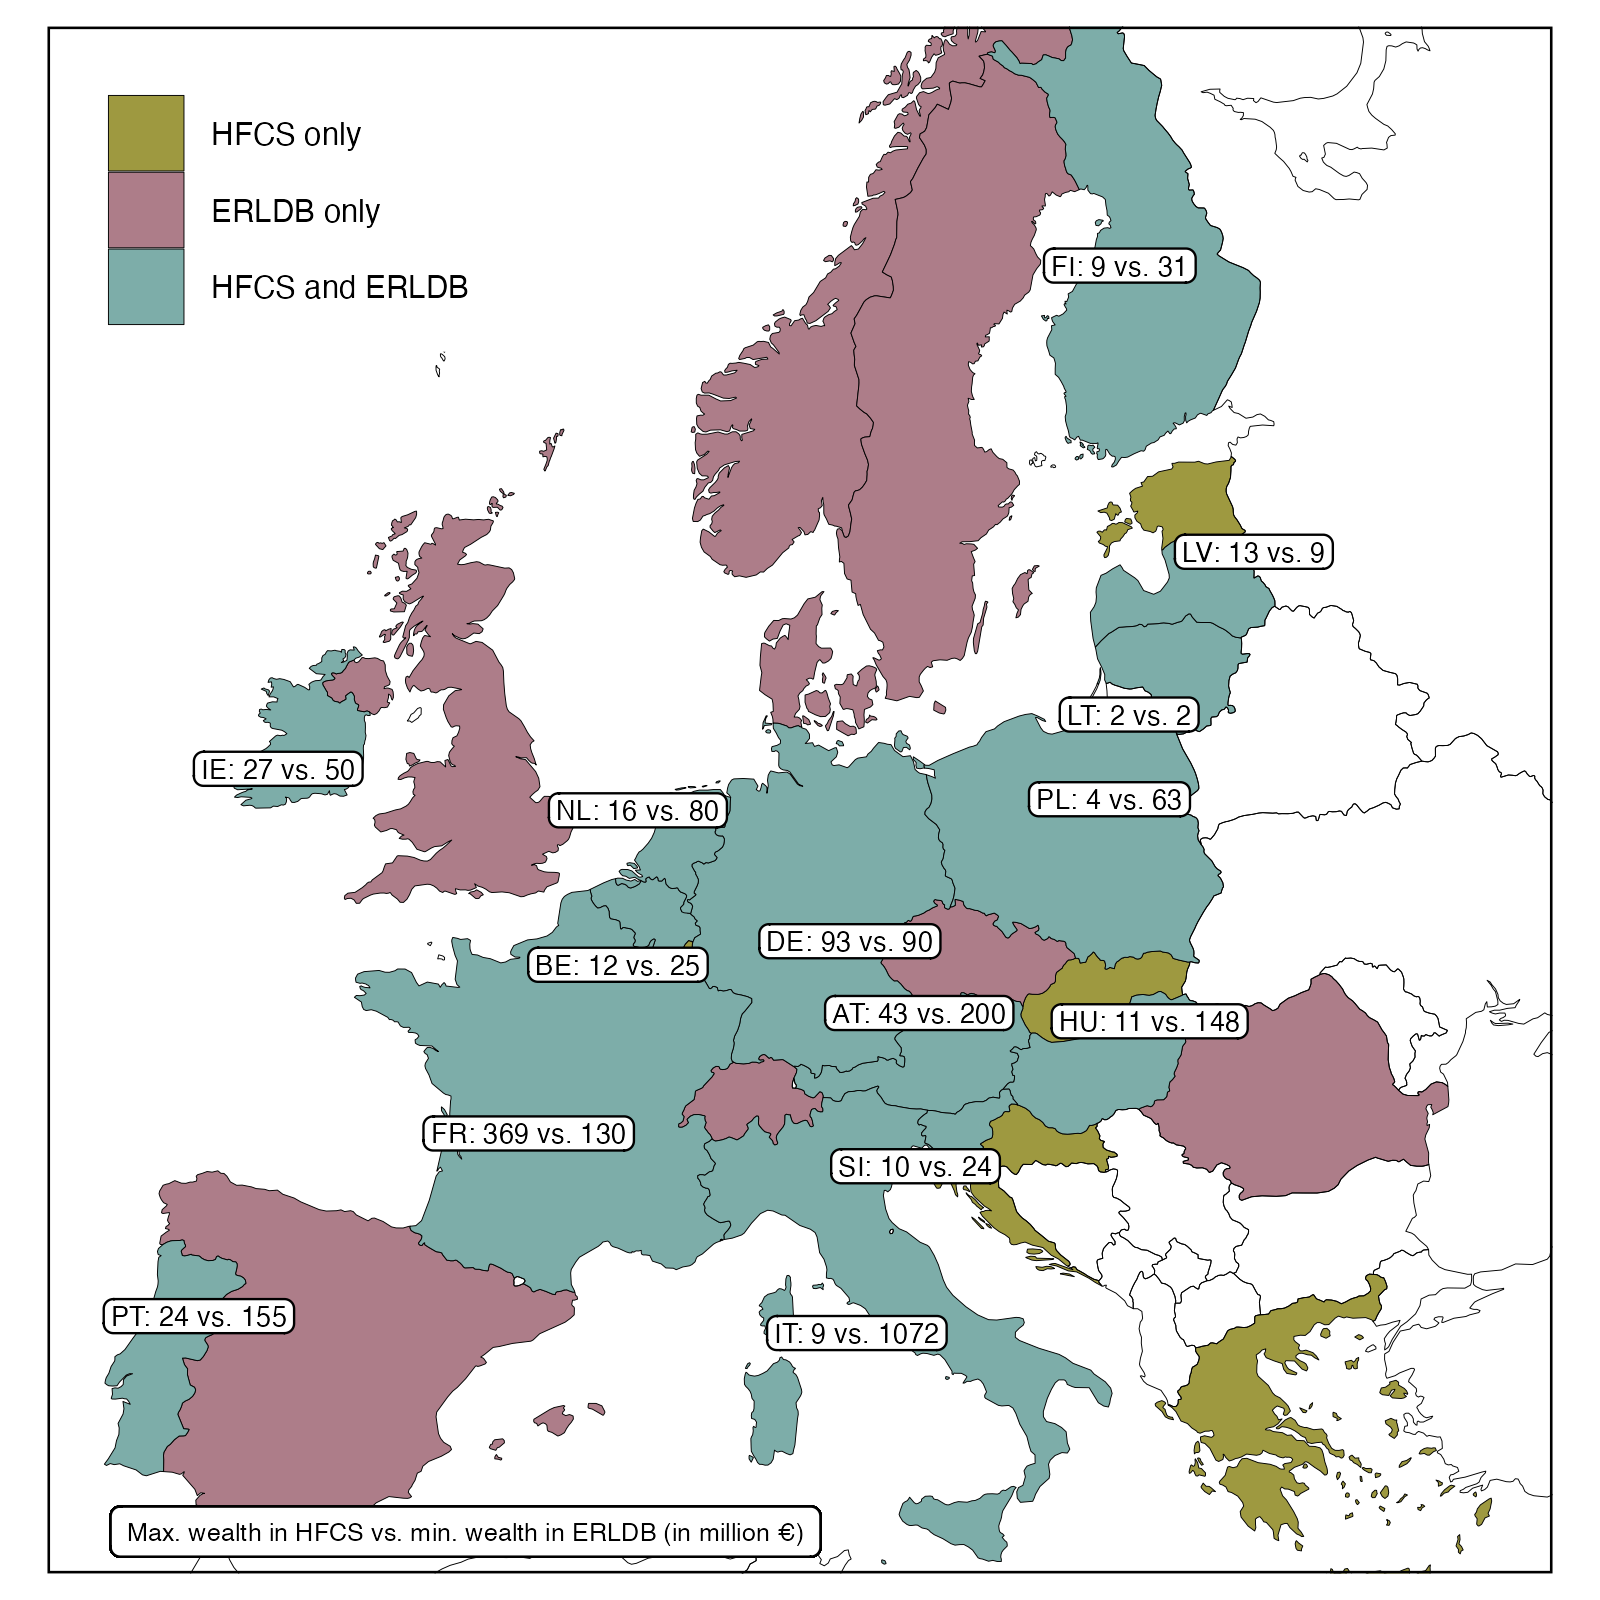 |
Survey data are based on representative samples drawn from total population. However, the probability of drawing one of the few very rich households into the sample is infinitesimal. Moreover, participation in surveys is mostly voluntary and there is a higher refusal rate at the top. This poor coverage of the top in wealth and income surveys conceals the extent of inequality. The figure shows the gap between the richest observation in wealth survey data (HFCS) and the “poorest” observation in national rich lists created by magazines. |
Discuss with your neighbour
What other potential flaws and challenges of data collection come to your mind?
How could these flaws be tackled by the researcher?


From conceptual disparities to data
Be aware of differences between data sources!
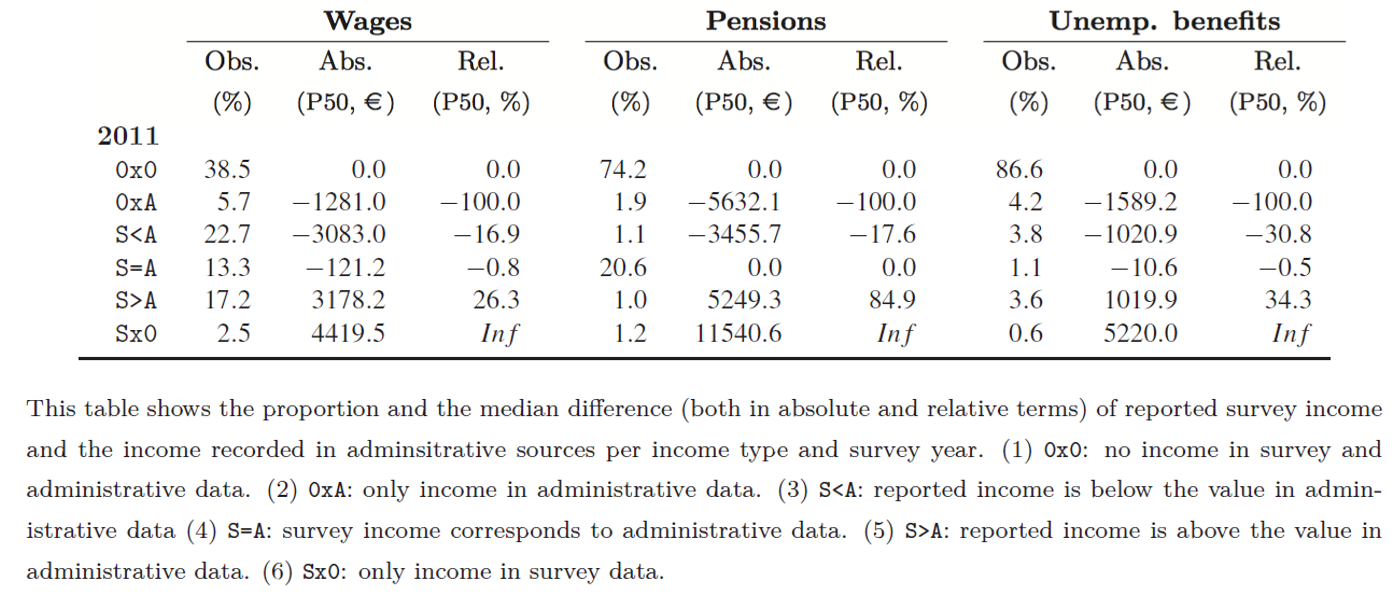
Administrative versus survey data
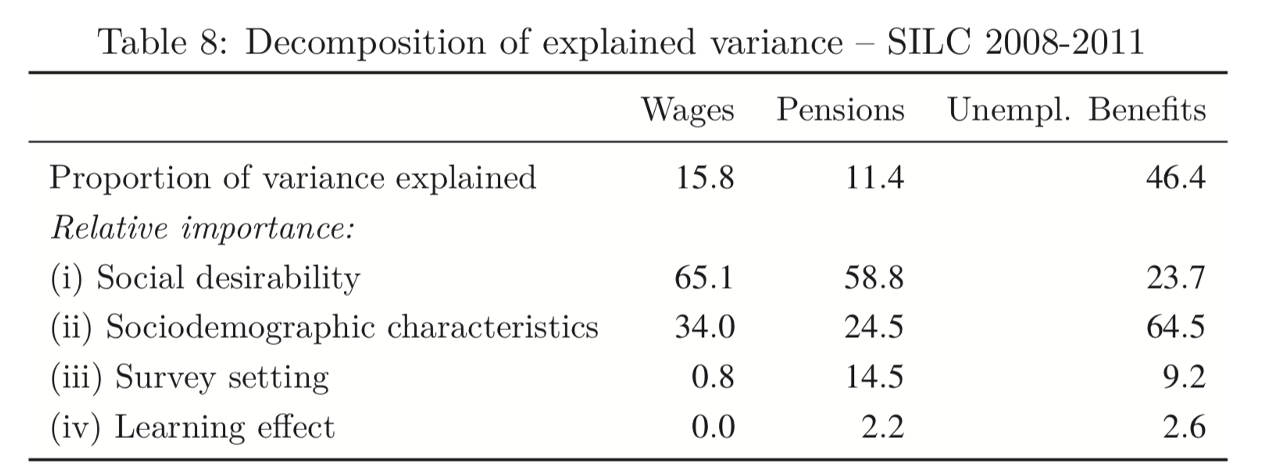
Impact on response behavior:
- Social desirability
- Sociodemographic characteristics
- Survey design
- Learning effect
Mean reverting errors
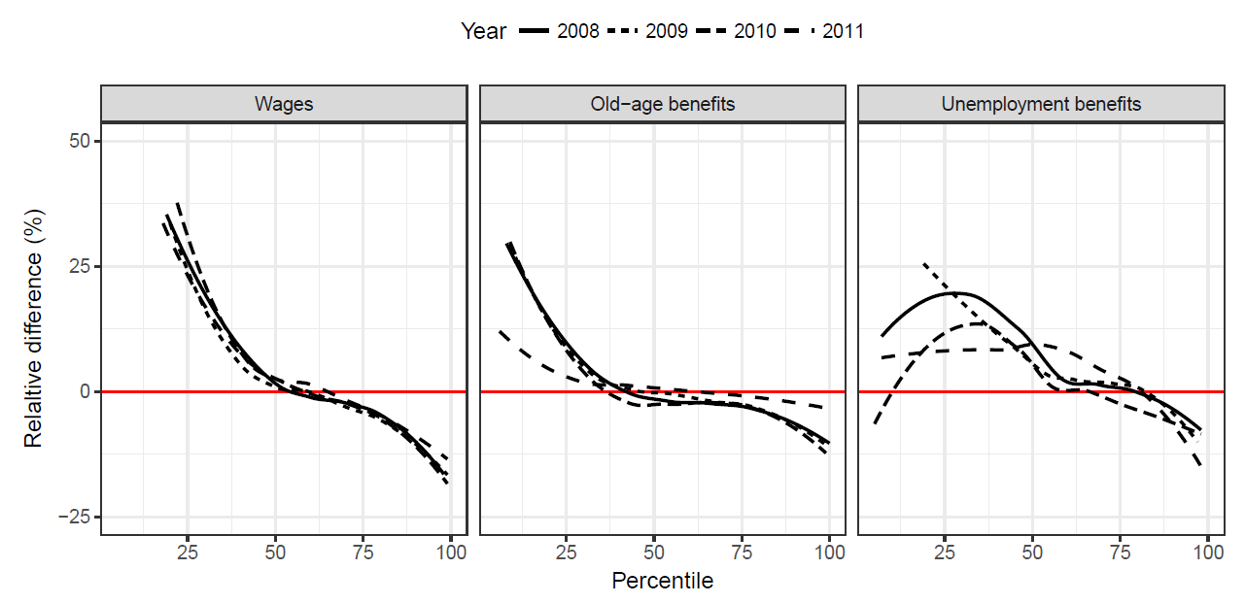
How do we explain the mismatch?
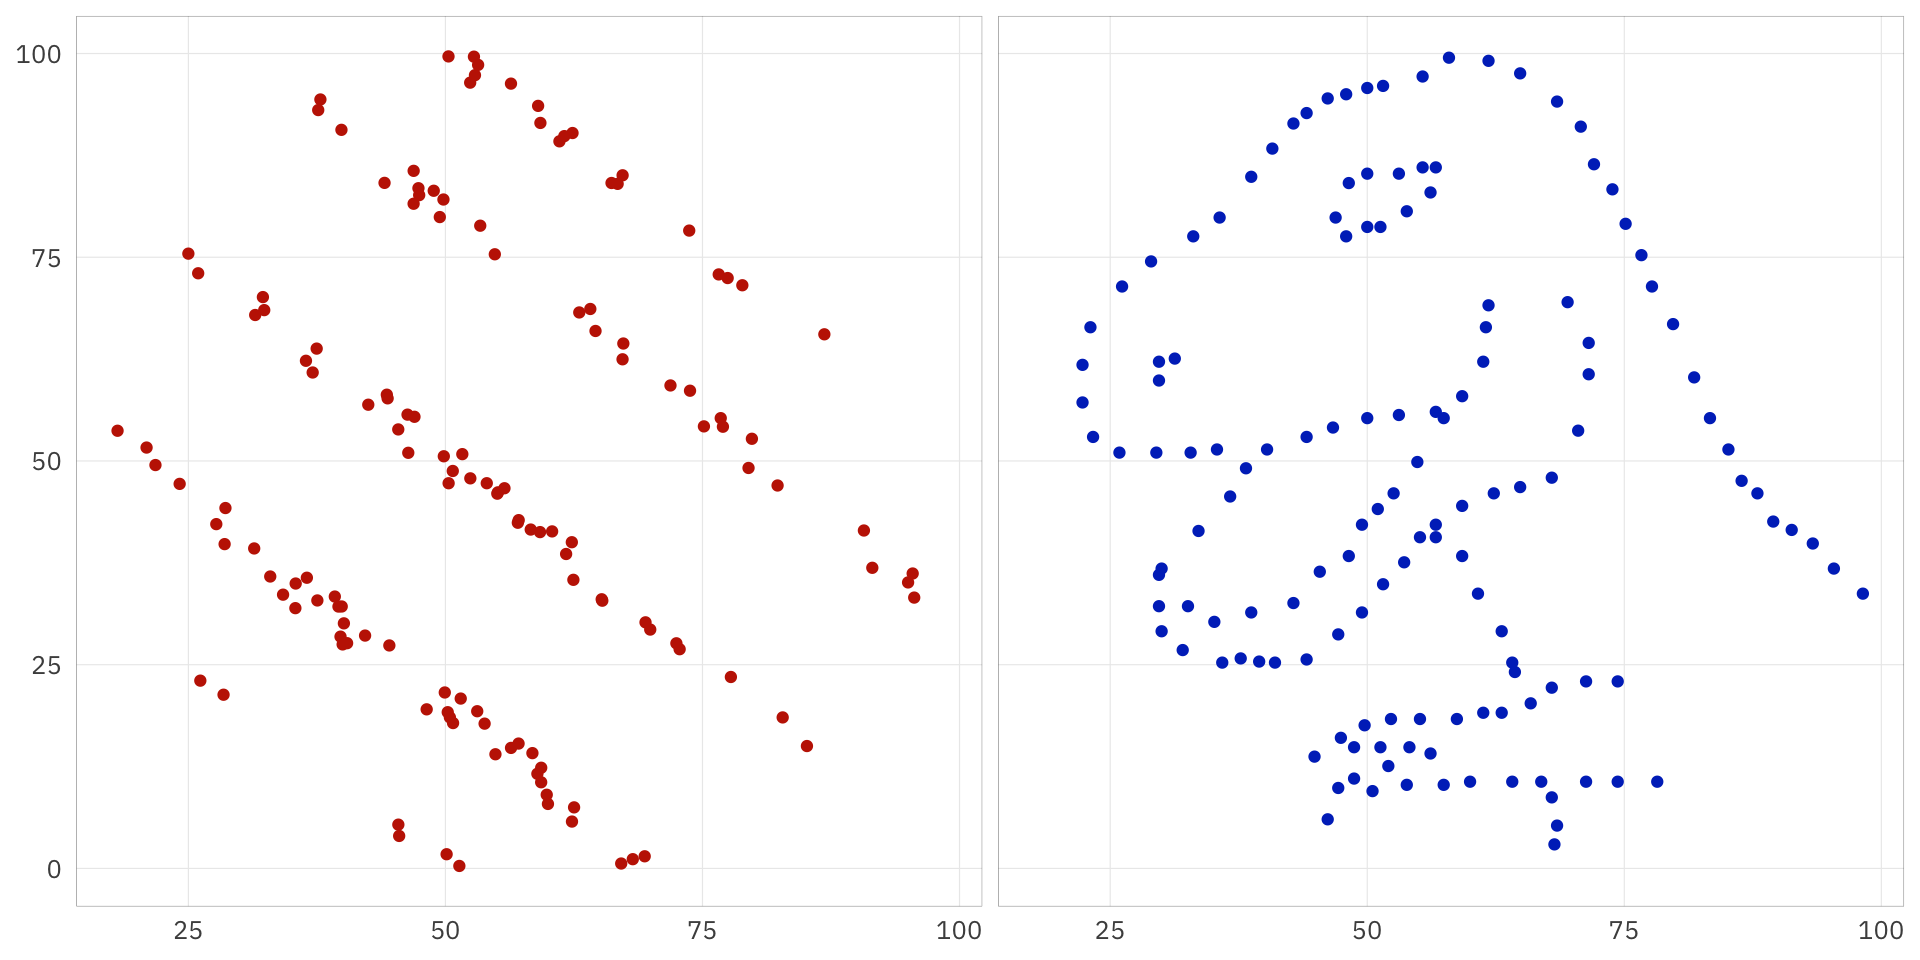
Why should we plot data?
What do we learn when plotting the data?
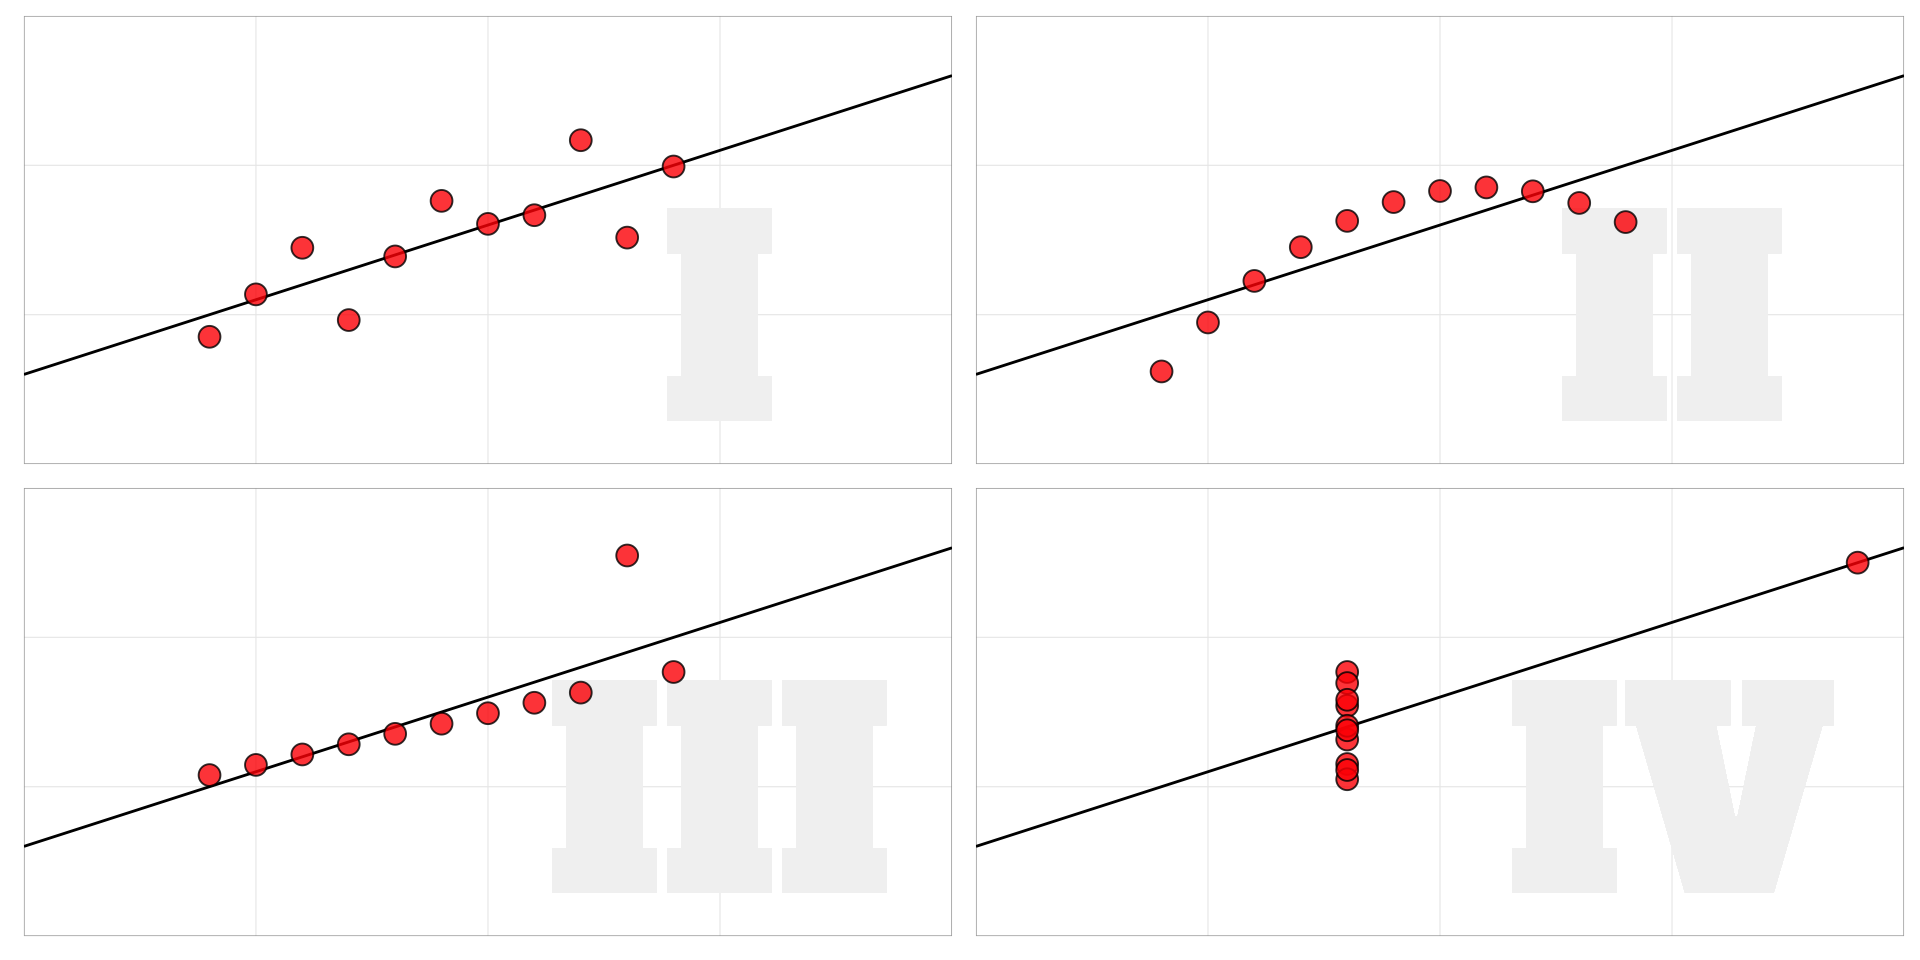
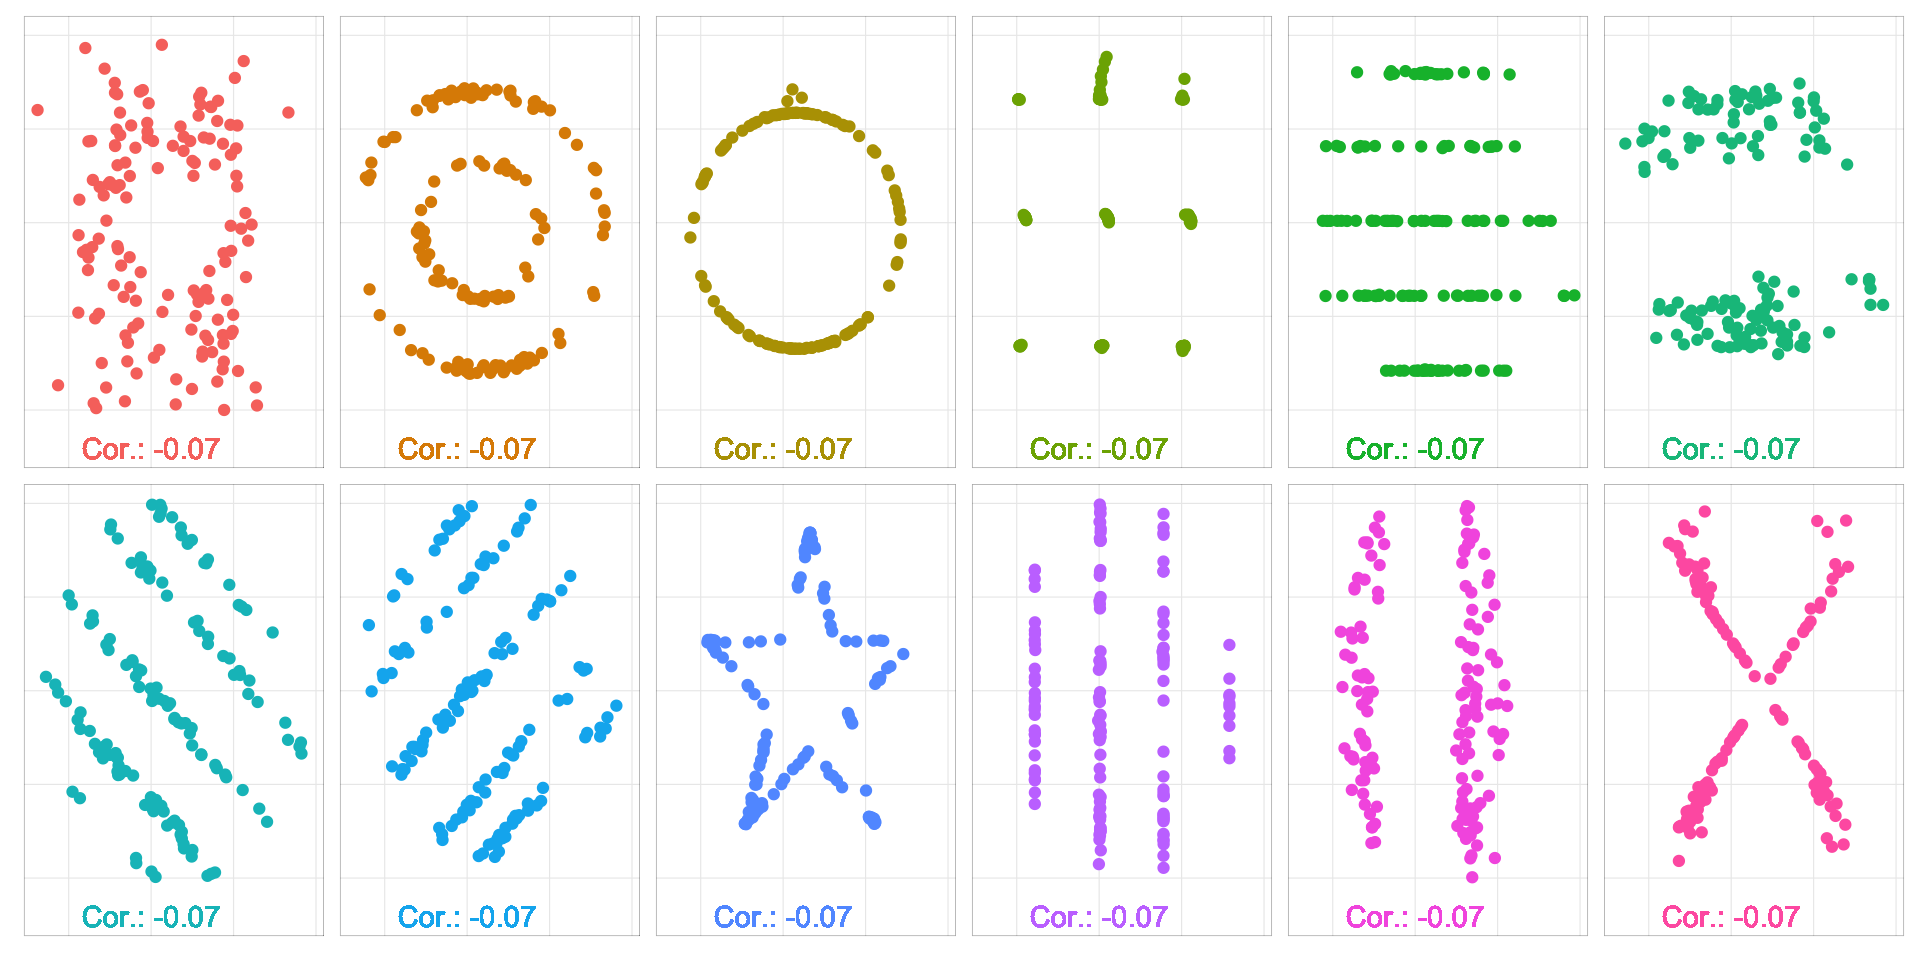
Do you see correlation?
Correlation: -0.07
Correlation: -0.07
Same same but different
Let’s start coding with the penguins

The Palmer Penguins

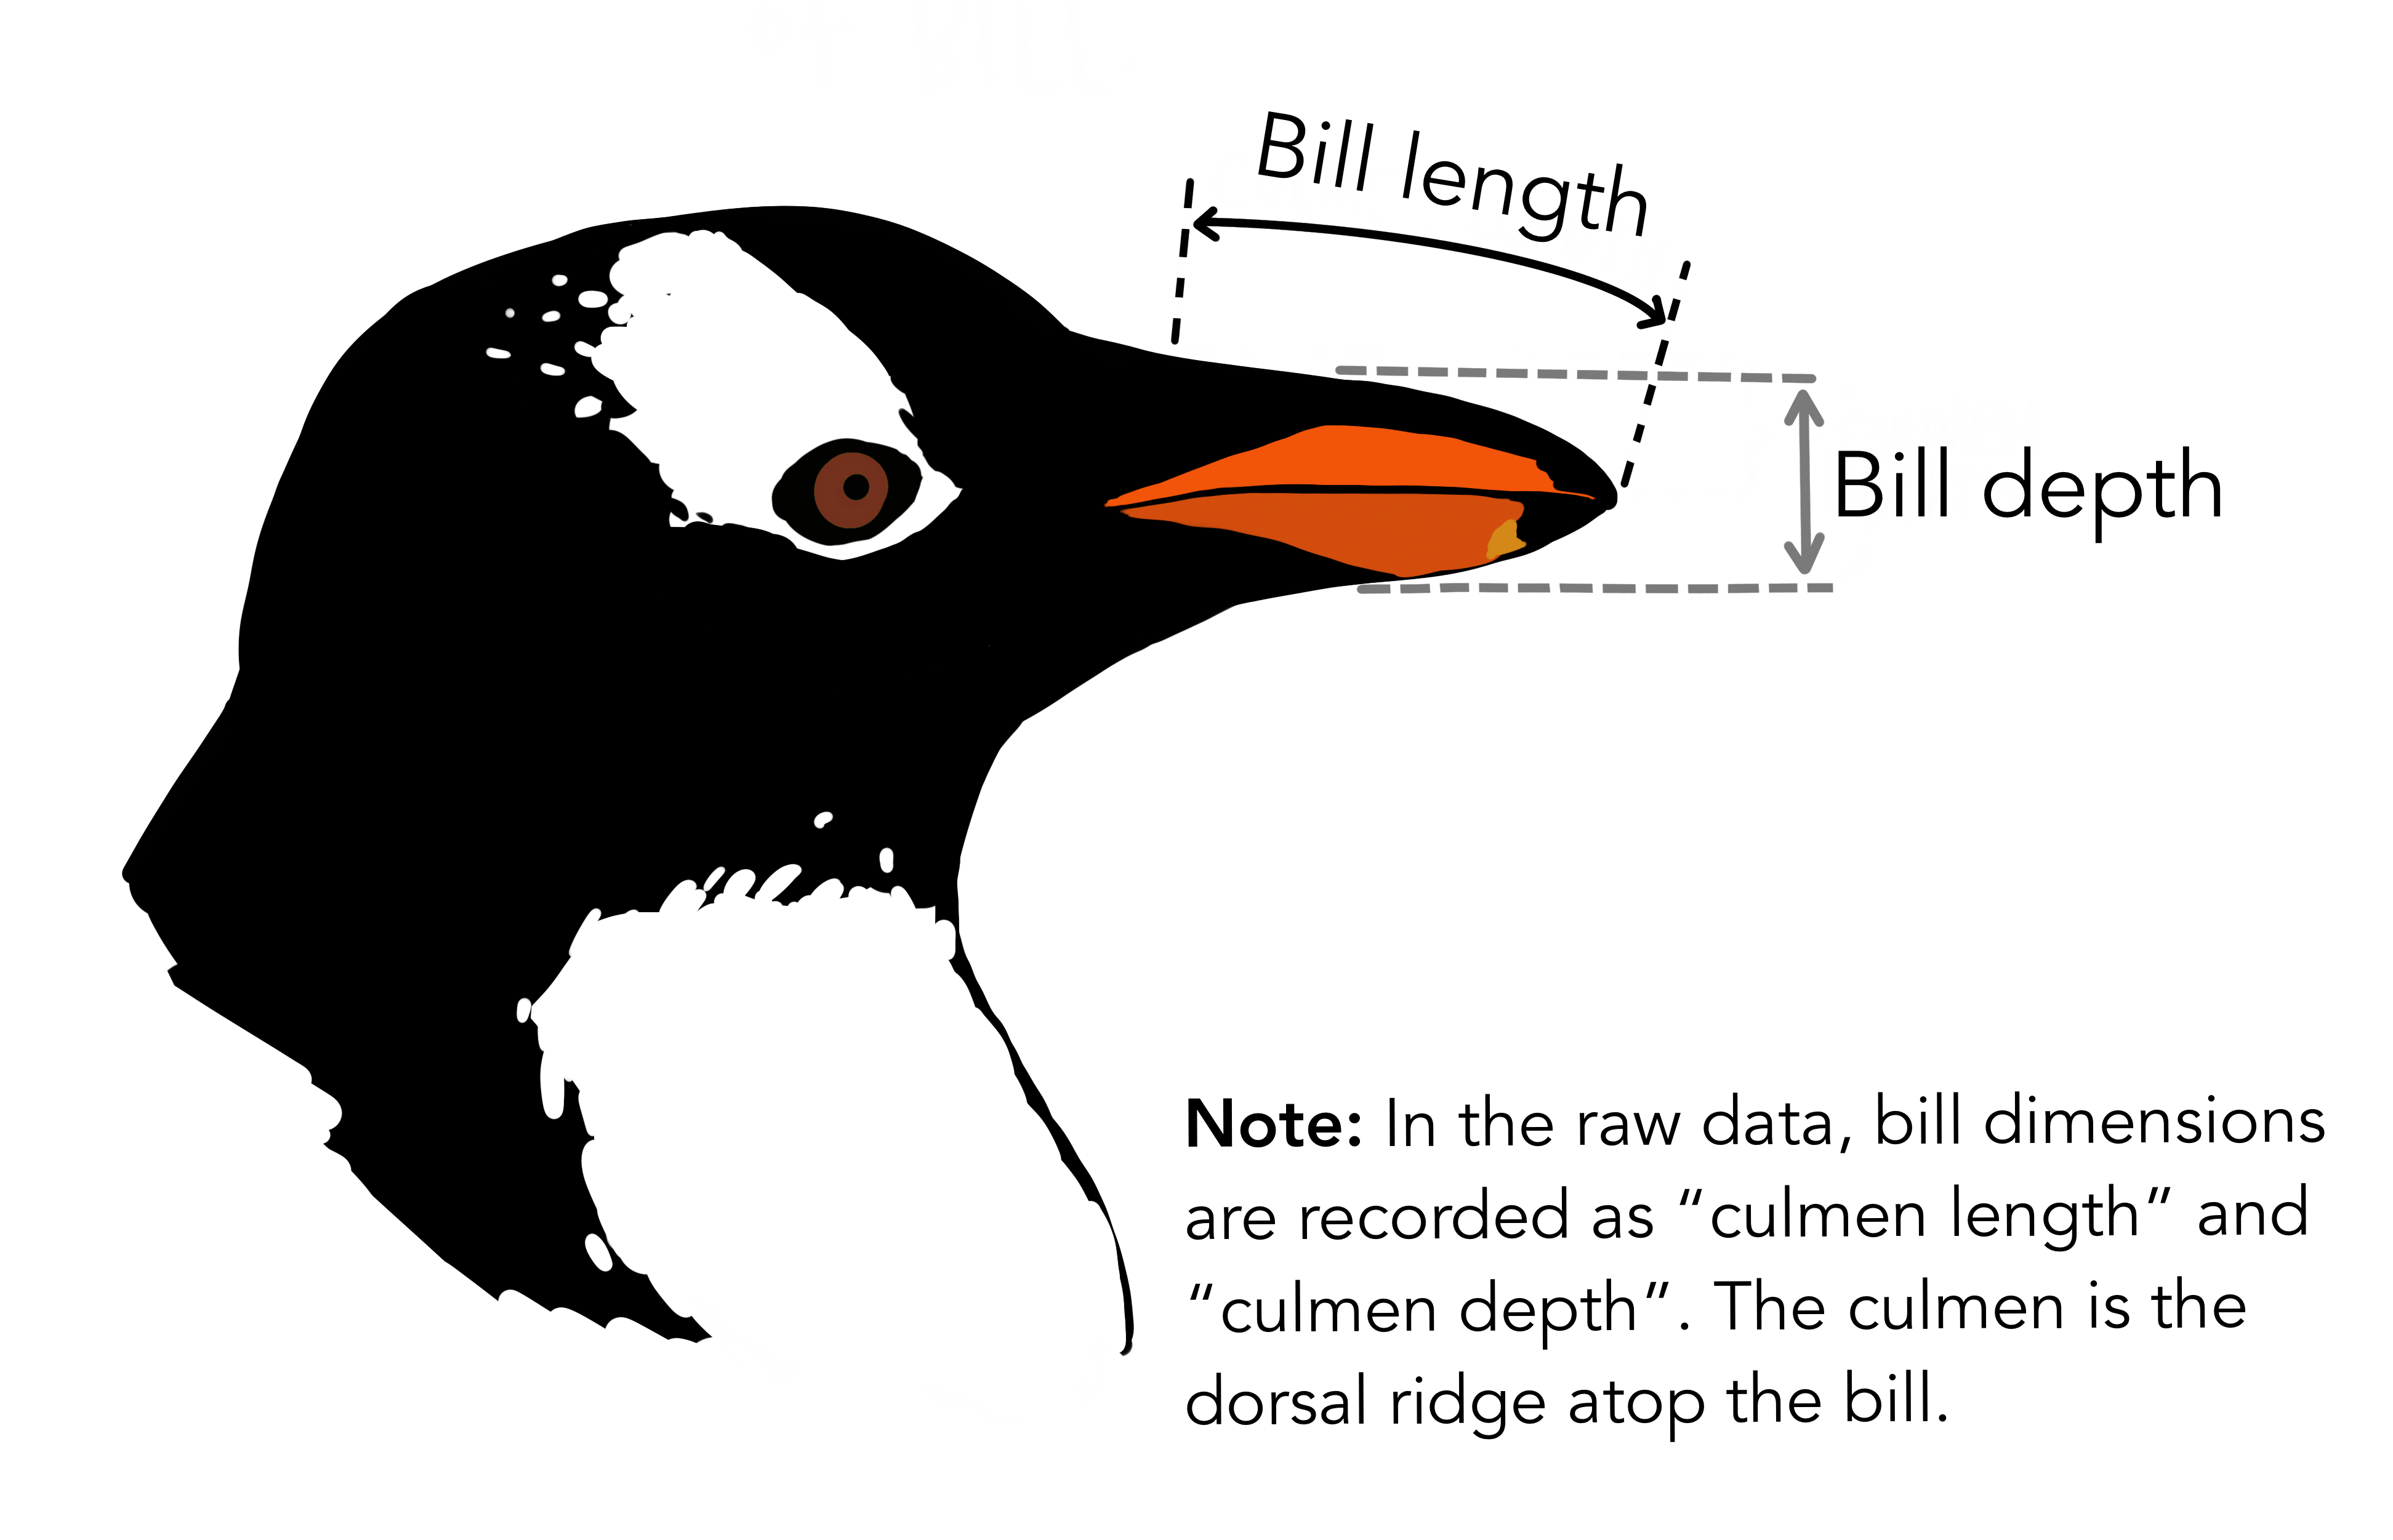
The data was collected from 2007-2009 by Dr. Kristen Gorman with the Palmer Station Long Term Ecological Research Program. The dataset contains data for 344 penguins. There are 3 different species of penguins, collected from 3 islands in the Palmer Archipelago, Antarctica.
Bibliography
![]()
Angel, Stefan/Disslbacher, Franziska/Humer, Stefan/Schnetzer, Matthias (2019). What did you really earn last year?: Explaining measurement error in survey income data. Journal of the Royal Statistical Society: Series A (Statistics in Society). DOI: 10.1111/rssa.12463
Angrist, Joshua/Azoulay, Pierre/Ellison, Glenn/Hill, Ryan/Lu, Susan Feng (2017). Economic research evolves: Fields and styles. American Economic Review, 107(5), 293–297. DOI: 10.1257/aer.p20171117
Brice, Brandon D./Montesinos-Yufa, Hugo M. (2019). The era of empirical evidence. Mimeo.
Disslbacher, Franziska/Ertl, Michael/List, Emanuel/Mokre, Patrick/Schnetzer, Matthias (2020). On top of the top - adjusting wealth distributions using national rich lists (Working Paper Series No. 20). INEQ.
Gorman, Kristen B./Williams, Tony D./Fraser, William R. (2014). Ecological sexual dimorphism and environmental variability within a community of antarctic penguins (genus pygoscelis). PLoS ONE, 9(3), e90081. DOI: 10.1371/journal.pone.0090081
United Nations (2011). Canberra group handbook on household income statistics (2nd ed.). Geneva: United Nations.